Skip to content
GravityDevOps GravityDevOps

DevOps & AI tutorials, hands-on guides, and interview prep for modern engineers.

  • DevOps
  • DOCKER
  • AI
    • AIOps
    • MLOps
    • LLMs & Generative AI
    • AI Coding Tools
  • Linux
  • CLOUD
    • AWS
    • AZURE
  • JENKINS
  • Git
  • INTERVIEW QUESTIONS
  • KUBERNETES
  • Terraform
  • Python
  • facebook.com
  • twitter.com
  • t.me
  • instagram.com
  • youtube.com
Subscribe

Monitoring

Prometheus and Grafana monitoring pipeline with metrics, dashboards, and alerts
Posted inDevOps

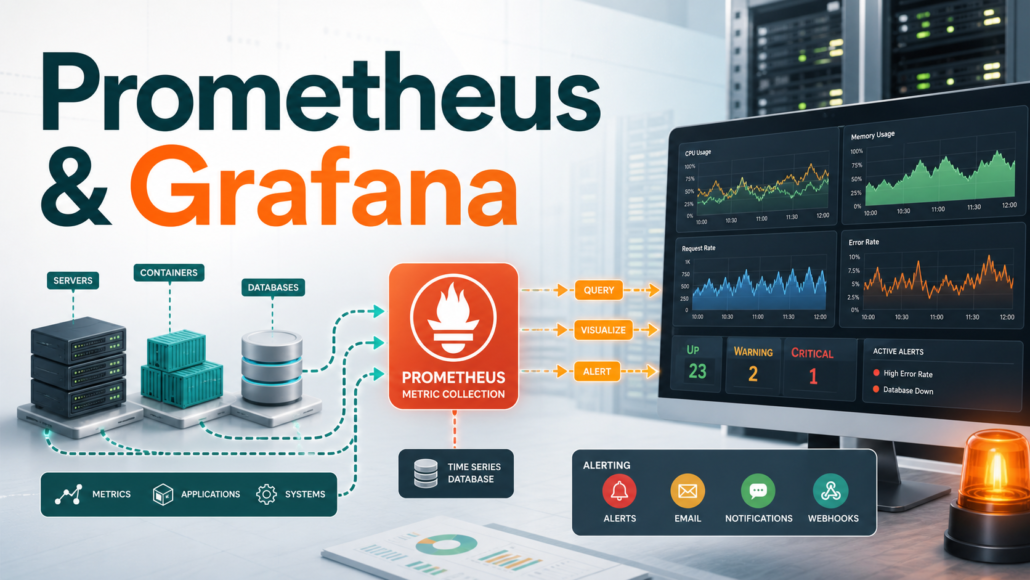
Prometheus & Grafana: Monitoring Tutorial

Learn how Prometheus and Grafana work together for DevOps monitoring, with Docker setup steps, scrape configs, PromQL examples, dashboard guidance, alerts, troubleshooting, and production best practices.
Posted by Saurabh Khan June 19, 2026
GravityDevOps covers a wide range of topics, including continuous integration and deployment, containerization, infrastructure as code, cloud computing, and more. The website features insightful articles, step-by-step guides, case studies, and practical tips to help you stay updated with the latest trends and technologies in the DevOps world.

  • About us
  • Blog
  • Contact us
  • Gravity Devops
  • GravityDevops
  • Privacy Policy for Gravity Devops
  • Terms and Conditions
  • AI Coding Tools
  • AIOps
  • Artificial Intelligence
  • AWS
  • AZURE
  • CLOUD
  • CONTAINERIZATION
  • DevOps
  • DOCKER
  • INTERVIEW QUESTIONS
  • JENKINS
  • KUBERNETES
  • Linux
  • LLMs & Generative AI
  • MLOps
  • Python
  • Terraform
  • Uncategorized
Copyright 2026 — GravityDevOps. All rights reserved.
Scroll to Top