
Quick Answer: Prometheus and Grafana are a practical monitoring stack for DevOps teams: Prometheus scrapes metrics from applications, infrastructure, containers, and exporters; Grafana connects to Prometheus, turns those time-series metrics into dashboards, and helps teams investigate and alert on production behavior. For a beginner setup, run Prometheus and Grafana with Docker Compose, expose a few /metrics targets, add Prometheus as a Grafana data source, build panels with PromQL, then add alerts only after the dashboard shows reliable signals.
If you are learning DevOps monitoring in 2026, Prometheus and Grafana are still two of the first tools worth understanding. They appear in Kubernetes clusters, VM-based platforms, platform engineering portals, SRE workflows, and managed cloud observability stacks. More importantly, they teach the core monitoring model: collect numeric signals, label them well, query them carefully, visualize what matters, and alert only when a human should act.
This tutorial walks through the stack from first principles to a working local setup, then shows practical PromQL examples, dashboard design, alerting, troubleshooting, and production guidance. It is written for beginners who want a concrete path and for practitioners who want fewer noisy dashboards and more useful operational signals.
What Prometheus and Grafana Do
Prometheus is the metrics engine. It discovers or is given a list of targets, pulls metrics from HTTP endpoints, stores samples as time series, and evaluates PromQL queries and rules. The official Prometheus overview describes the main server as the component that scrapes and stores time-series data, with supporting components such as client libraries, exporters, Pushgateway, Alertmanager, and service discovery.
Grafana is the visualization and analysis layer. Grafana includes built-in support for Prometheus as a data source, so you do not need a separate plugin. Once connected, you can use Grafana dashboards, Explore, variables, transformations, and alerting to turn Prometheus metrics into something teams can actually use during incidents and reviews.
How the Monitoring Flow Works
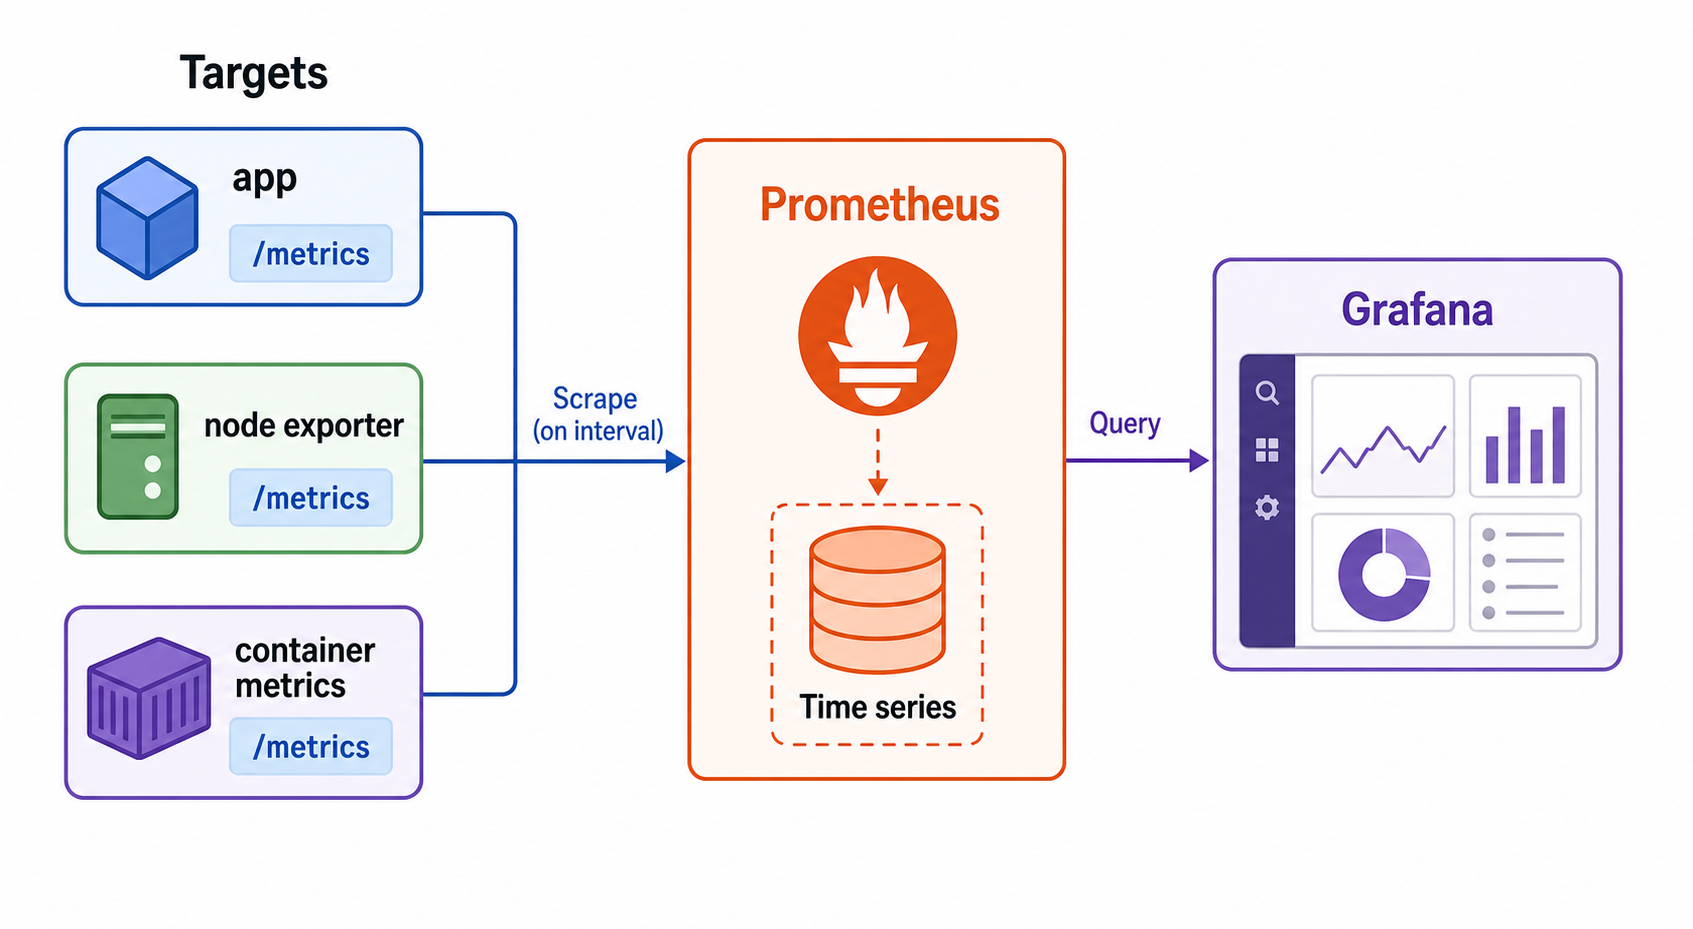
A basic Prometheus and Grafana flow looks like this:
- Your app, host, container platform, or exporter exposes metrics over HTTP, often at
/metrics. - Prometheus scrapes those targets at a configured interval.
- Prometheus stores samples locally as time series with metric names and labels.
- You write PromQL queries to calculate rates, averages, percentiles, ratios, and aggregations.
- Grafana queries Prometheus and displays the results in panels.
- Alerting rules notify humans when a symptom needs action.
This pull-based model is simple but powerful. Instead of every service deciding where to push data, Prometheus asks each target for its current metrics. That makes target health visible: if a scrape fails, Prometheus can show that the target is down or unreachable.
Prometheus vs Grafana: The Simple Difference
| Area | Prometheus | Grafana |
|---|---|---|
| Main role | Metric collection, storage, querying, rules | Dashboards, exploration, visualization, alert UX |
| Query language | PromQL | Uses PromQL when the data source is Prometheus |
| Data storage | Stores time-series samples locally or via remote storage patterns | Does not replace Prometheus storage for Prometheus metrics |
| Best beginner use | Confirm targets are scraped and queries return data | Build readable dashboards and share them with teams |
| Common production pairing | Prometheus plus Alertmanager, remote write, Thanos, Mimir, or Cortex when scaling | Grafana connected to Prometheus-compatible sources and other observability systems |
Prerequisites
For this beginner tutorial, you need:
- Docker and Docker Compose installed.
- Basic terminal comfort.
- A text editor.
- Ports
9090and3000available on your machine.
You can also install Prometheus and Grafana directly on Linux, macOS, or Windows, but Docker Compose keeps the tutorial repeatable and easy to clean up.
Step 1: Create a Local Monitoring Lab
Create a folder named prometheus-grafana-lab and add this docker-compose.yml:
services:
  prometheus:
    image: prom/prometheus:latest
    container_name: prometheus
    ports:
      - "9090:9090"
    volumes:
      - ./prometheus.yml:/etc/prometheus/prometheus.yml:ro

  grafana:
    image: grafana/grafana-oss:latest
    container_name: grafana
    ports:
      - "3000:3000"
    environment:
      - GF_SECURITY_ADMIN_USER=admin
      - GF_SECURITY_ADMIN_PASSWORD=admin
    volumes:
      - grafana-storage:/var/lib/grafana

  node-exporter:
    image: prom/node-exporter:latest
    container_name: node-exporter
    ports:
      - "9100:9100"

volumes:
  grafana-storage:
This starts three services: Prometheus, Grafana OSS, and Node Exporter. Node Exporter exposes host-level metrics such as CPU, memory, filesystem, and network counters.
Step 2: Configure Prometheus Scrapes
In the same folder, create prometheus.yml:
global:
  scrape_interval: 15s
  evaluation_interval: 15s

scrape_configs:
  - job_name: "prometheus"
    static_configs:
      - targets: ["prometheus:9090"]

  - job_name: "node"
    static_configs:
      - targets: ["node-exporter:9100"]
The scrape_interval controls how often Prometheus collects samples. For a local tutorial, 15 seconds gives quick feedback. In production, choose intervals based on signal importance, storage cost, and how fast you need to detect changes.
Start the stack:
docker compose up -d
Open Prometheus at http://localhost:9090. Go to Status > Targets. You should see the prometheus and node jobs as UP.
Step 3: Run Your First PromQL Queries
PromQL is the query language for Prometheus. Start with simple expressions in the Prometheus web UI.
Check whether targets are up:
up
Filter by job:
up{job="node"}
CPU metrics are counters, so you usually query them with rate() over a range:
100 - (avg by (instance) (rate(node_cpu_seconds_total{mode="idle"}[5m])) * 100)
Available memory percentage can be estimated like this:
100 * (1 - (node_memory_MemAvailable_bytes / node_memory_MemTotal_bytes))
Filesystem usage percentage:
100 * (1 - (node_filesystem_avail_bytes{fstype!="tmpfs"} / node_filesystem_size_bytes{fstype!="tmpfs"}))
A beginner mistake is querying raw counters directly and wondering why graphs only climb. Counters such as request totals, CPU seconds, and error totals should usually be converted with rate() or increase().
Step 4: Add Prometheus as a Grafana Data Source
Open Grafana at http://localhost:3000. Log in with admin / admin for this local lab, then change the password if prompted.
Add Prometheus:
- Go to Connections or Data sources.
- Select Prometheus.
- Use
http://prometheus:9090as the Prometheus server URL inside this Docker Compose network. - Click Save & test.
This URL matters. If Grafana runs in a container, localhost:9090 points to the Grafana container itself, not the Prometheus container. Grafana’s own documentation calls out this container networking issue. In Docker Compose, the service name prometheus is the reliable hostname.
Step 5: Build a Useful First Dashboard
Create a new Grafana dashboard with a few panels. Do not start with twenty charts. Start with the signals that help answer operational questions quickly.
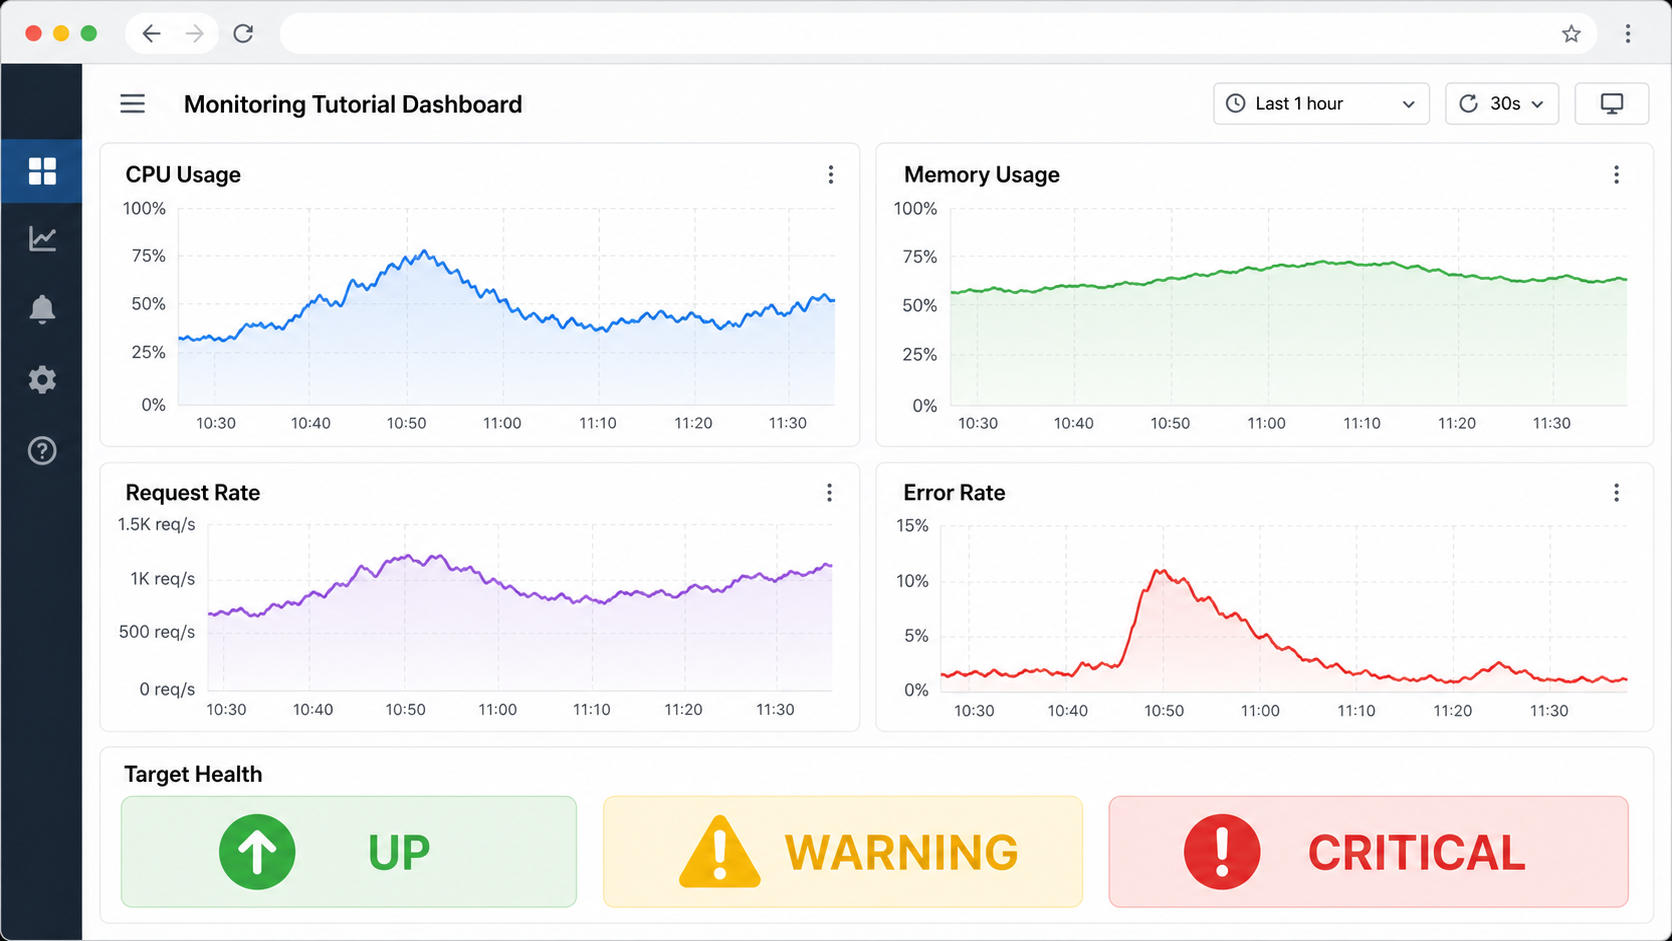
Panel 1: Target Health
up
Use a stat panel or table. If up is 0, Prometheus cannot scrape the target successfully.
Panel 2: CPU Usage
100 - (avg by (instance) (rate(node_cpu_seconds_total{mode="idle"}[$__rate_interval])) * 100)
In Grafana, $__rate_interval is often safer than a fixed [5m] for rate queries because it adapts to the dashboard interval and scrape interval.
Panel 3: Memory Usage
100 * (1 - (node_memory_MemAvailable_bytes / node_memory_MemTotal_bytes))
Panel 4: Request Rate
If your application exposes http_requests_total, use:
sum(rate(http_requests_total[$__rate_interval]))
Panel 5: Error Rate
sum(rate(http_requests_total{status=~"5.."}[$__rate_interval]))
/
sum(rate(http_requests_total[$__rate_interval]))
Format this as a percentage. Error ratio usually tells a better story than raw error count because it accounts for traffic volume.
Step 6: Instrument an Application
Exporters are useful, but the best monitoring usually comes from application metrics. For a web API, expose metrics such as:
http_requests_totalby route, method, and status.http_request_duration_secondsas a histogram.- Queue depth or worker backlog.
- External dependency latency and failures.
- Business-relevant counters, such as jobs processed or payments attempted, when appropriate.
A small Python Flask app can expose Prometheus metrics like this:
from flask import Flask
from prometheus_client import Counter, Histogram, generate_latest
import time

app = Flask(__name__)
REQUESTS = Counter("http_requests_total", "Total HTTP requests", ["path", "status"])
LATENCY = Histogram("http_request_duration_seconds", "Request latency", ["path"])

@app.route("/")
def home():
    start = time.time()
    REQUESTS.labels(path="/", status="200").inc()
    LATENCY.labels(path="/").observe(time.time() - start)
    return "ok"

@app.route("/metrics")
def metrics():
    return generate_latest(), 200, {"Content-Type": "text/plain; version=0.0.4"}
For production services, use the official Prometheus client library for your language and be careful with labels. A label like user_id, request_id, or full URL path can create high cardinality and cause performance or storage problems.
PromQL Patterns Worth Learning Early
| Goal | Query pattern | Why it helps |
|---|---|---|
| Per-second request rate | sum(rate(http_requests_total[$__rate_interval])) | Shows traffic volume over time |
| Error ratio | sum(rate(http_requests_total{status=~"5.."}[$__rate_interval])) / sum(rate(http_requests_total[$__rate_interval])) | Normalizes errors by traffic |
| Latency p95 | histogram_quantile(0.95, sum by (le) (rate(http_request_duration_seconds_bucket[$__rate_interval]))) | Shows tail latency from histogram buckets |
| Group by service | sum by (service) (rate(http_requests_total[$__rate_interval])) | Compares workload by label |
| Target availability | avg_over_time(up[5m]) | Shows whether targets stayed reachable |
Alerting: Start with Symptoms, Not Every Metric
Beginners often alert on CPU above 80 percent, memory above 80 percent, or every scrape failure. That creates noise. Better alerts point to user impact or imminent platform risk.
Good first alert ideas:
- Service down for more than a few minutes.
- 5xx error ratio above a meaningful threshold.
- Latency p95 or p99 above the service objective.
- Disk predicted to fill soon.
- Prometheus target missing for a critical service.
Example alert rule for a service being down:
groups:
  - name: service-health
    rules:
      - alert: ServiceTargetDown
        expr: up{job="api"} == 0
        for: 5m
        labels:
          severity: page
        annotations:
          summary: "API target is down"
          description: "Prometheus has not scraped the API target for 5 minutes."
The for clause matters. It prevents short restarts or temporary network blips from paging someone immediately.
Troubleshooting Prometheus and Grafana
When something does not work, avoid guessing. Walk the path from target to Prometheus to Grafana.
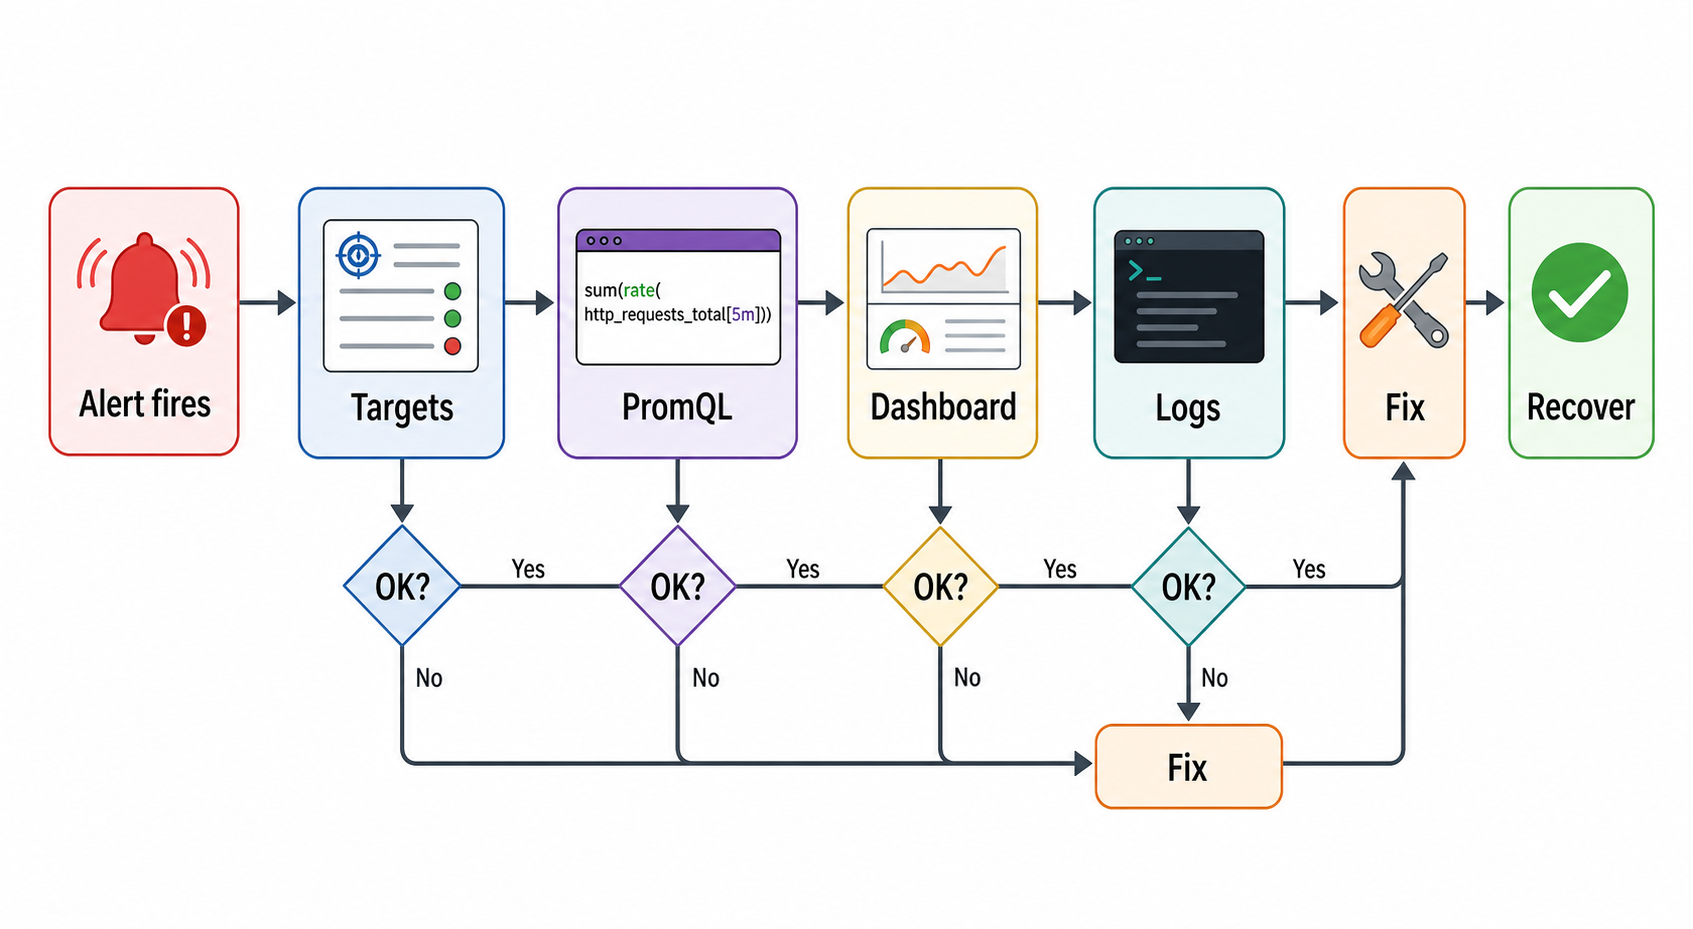
Problem: Prometheus target is down
- Open
http://localhost:9090/targets. - Check the error message next to the target.
- Confirm the target is reachable from the Prometheus container or host.
- Check whether the endpoint returns Prometheus text format.
- Verify the configured hostname and port.
Problem: Grafana cannot connect to Prometheus
- Use the correct URL for where Grafana is running.
- In Docker Compose, prefer
http://prometheus:9090. - If Grafana runs outside Docker,
http://localhost:9090may be correct. - Include the protocol:
http://orhttps://. - Check firewalls, reverse proxies, TLS settings, and authentication.
Problem: The dashboard is empty
- Run the query in Prometheus first.
- Check the Grafana time range.
- Confirm labels match your actual metrics.
- Use Explore to inspect available metric names.
- Replace fixed
[1m]windows with[$__rate_interval]for Grafana rate queries.
Problem: PromQL returns weird values
- Do not graph raw counters as if they were gauges.
- Use
rate()for per-second trends andincrease()for total change over a window. - Aggregate intentionally with
sum by (...)oravg by (...). - Check whether a label has too many values.
- Use Prometheus expression browser to isolate query behavior before building the panel.
Production Best Practices
Keep Label Cardinality Under Control
Labels are powerful because they let you filter and group metrics. They are dangerous when each label has too many unique values. Avoid labels such as user ID, session ID, request ID, email address, full URL, or unbounded error message. Prefer bounded labels like service, environment, route template, method, status class, region, and cluster.
Design Dashboards Around Questions
A dashboard should answer specific questions: Is the service up? Are users seeing errors? Is latency rising? Is the dependency failing? Is capacity running out? If a panel does not support a decision, remove it or move it to a deep-dive dashboard.
Separate Overview and Drill-Down Views
Create one executive or on-call overview dashboard with a small number of high-signal panels. Then create service, infrastructure, and dependency drill-down dashboards for investigation. This keeps the first view useful during incidents.
Use Recording Rules for Expensive Queries
If a dashboard repeatedly runs expensive PromQL expressions, consider Prometheus recording rules. Recording rules precompute query results so dashboards and alerts can read simpler time series.
Plan for Scale
A single Prometheus server is a good starting point and is intentionally reliable as a standalone system. As environments grow, teams commonly add remote write, long-term storage, federation, Thanos, Mimir, Cortex, or managed Prometheus-compatible services. Do not introduce distributed complexity before you understand your scrape volume, retention needs, and query patterns.
Common Mistakes to Avoid
- Using localhost incorrectly: inside a container, localhost means that same container.
- Alerting on everything: alert on symptoms and actionable risk, not every noisy threshold.
- Ignoring cardinality: unbounded labels can make monitoring slow and expensive.
- Copying dashboards blindly: imported dashboards can help, but verify every query matches your labels and environment.
- Skipping runbooks: every paging alert should link to what the responder should check first.
- Only monitoring infrastructure: application and business-flow metrics often explain user impact faster.
Beginner Learning Path
- Run Prometheus and Grafana locally with Docker Compose.
- Scrape Prometheus itself and Node Exporter.
- Learn
up,rate(),sum by, andhistogram_quantile(). - Add one application metric endpoint.
- Build a small dashboard with target health, traffic, errors, latency, CPU, and memory.
- Add one low-noise alert with a runbook.
- Review cardinality and remove labels that grow without bounds.
- Explore Kubernetes monitoring only after the local model makes sense.
Internal Links and Next Steps
If you are building a broader DevOps learning path, pair this tutorial with the Best CI/CD Tools 2026 comparison to understand how deployment pipelines connect with production feedback loops. For AI-heavy teams, also read What Is Generative AI? A Beginner’s Guide, because modern AI applications need the same monitoring discipline plus model-specific metrics such as latency, token usage, retrieval quality, and error rates.
Useful future cluster links for GravityDevOps include Kubernetes monitoring tools, GitOps with Argo CD, Amazon EKS, Helm, AIOps tools, and LLMOps. Those topics naturally connect back to Prometheus and Grafana because observability is the feedback layer for every reliable platform.
FAQ
Is Prometheus the same as Grafana?
No. Prometheus collects, stores, and queries metrics. Grafana visualizes those metrics in dashboards and can also manage alerting workflows. They are commonly used together, but they solve different parts of monitoring.
Do I need Kubernetes to use Prometheus and Grafana?
No. You can run both with Docker, Docker Compose, Linux binaries, Kubernetes, or a managed platform. Kubernetes is common in production, but Docker Compose is easier for learning the basics.
What is the default Prometheus port?
Prometheus commonly exposes its web UI and HTTP API on port 9090. Grafana commonly runs on port 3000 in local tutorials.
What should I monitor first?
Start with target health, CPU, memory, disk, request rate, error rate, latency, and service-level indicators that connect directly to user impact.
Why is my Grafana dashboard empty?
Common causes are an incorrect Prometheus URL, using localhost from the wrong container, no matching metric labels, a time range with no samples, or a PromQL query that returns no series.
Should alerts live in Prometheus or Grafana?
Both can work. Prometheus alerting is mature and pairs with Alertmanager, while Grafana alerting is convenient when teams manage rules near dashboards and use multiple data sources. Choose one primary path to avoid duplicate noisy alerts.
Schema-Ready FAQ Structure
The FAQ above is structured as question headings followed by direct answers. It is also included below as JSON-LD for schema-capable WordPress themes and SEO plugins.
{
  "@context": "https://schema.org",
  "@type": "FAQPage",
  "mainEntity": [
    {
      "@type": "Question",
      "name": "Is Prometheus the same as Grafana?",
      "acceptedAnswer": {
        "@type": "Answer",
        "text": "No. Prometheus collects, stores, and queries metrics. Grafana visualizes those metrics in dashboards and can also manage alerting workflows. They are commonly used together, but they solve different parts of monitoring."
      }
    },
    {
      "@type": "Question",
      "name": "Do I need Kubernetes to use Prometheus and Grafana?",
      "acceptedAnswer": {
        "@type": "Answer",
        "text": "No. You can run both with Docker, Docker Compose, Linux binaries, Kubernetes, or a managed platform. Kubernetes is common in production, but Docker Compose is easier for learning the basics."
      }
    },
    {
      "@type": "Question",
      "name": "What is the default Prometheus port?",
      "acceptedAnswer": {
        "@type": "Answer",
        "text": "Prometheus commonly exposes its web UI and HTTP API on port 9090. Grafana commonly runs on port 3000 in local tutorials."
      }
    },
    {
      "@type": "Question",
      "name": "What should I monitor first?",
      "acceptedAnswer": {
        "@type": "Answer",
        "text": "Start with target health, CPU, memory, disk, request rate, error rate, latency, and service-level indicators that connect directly to user impact."
      }
    },
    {
      "@type": "Question",
      "name": "Why is my Grafana dashboard empty?",
      "acceptedAnswer": {
        "@type": "Answer",
        "text": "Common causes are an incorrect Prometheus URL, using localhost from the wrong container, no matching metric labels, a time range with no samples, or a PromQL query that returns no series."
      }
    },
    {
      "@type": "Question",
      "name": "Should alerts live in Prometheus or Grafana?",
      "acceptedAnswer": {
        "@type": "Answer",
        "text": "Both can work. Prometheus alerting is mature and pairs with Alertmanager, while Grafana alerting is convenient when teams manage rules near dashboards and use multiple data sources. Choose one primary path to avoid duplicate noisy alerts."
      }
    }
  ]
}