
SEO excerpt: Compare the best Kubernetes monitoring tools in 2026, including Prometheus, Grafana, Datadog, Dynatrace, New Relic, Elastic, OpenTelemetry, and cloud-native options. Learn which tool fits your team, budget, and production maturity.
Best Kubernetes Monitoring Tools in 2026
Kubernetes monitoring in 2026 is no longer just about checking CPU and memory. A production cluster needs metrics, logs, traces, events, cost signals, deployment context, alert routing, service-level objectives, and a sane way to debug incidents without opening six tabs during an outage.
The best Kubernetes monitoring tool depends on what you are optimizing for. A small platform team may be better served by Prometheus and Grafana. A fast-growing SaaS team may need Datadog or New Relic to connect infrastructure, APM, logs, and deployments. A regulated enterprise may prefer Dynatrace or Elastic because of governance, topology, and deployment-control requirements. And almost every modern stack should understand where OpenTelemetry fits, even if it is not the final dashboard.
Quick Answer
The best overall Kubernetes monitoring stack for most technical teams in 2026 is Prometheus plus Grafana, with OpenTelemetry for application telemetry and a managed backend when operational overhead becomes too high. Choose Datadog or New Relic if you want a faster SaaS path across metrics, logs, traces, and cloud integrations. Choose Dynatrace if you need enterprise-grade topology, automation, and AI-assisted root-cause analysis. Choose Elastic if logs and search-heavy troubleshooting are central to your operations.
For teams already learning Kubernetes on AWS, pair this guide with our Amazon EKS tutorial. If you are new to observability fundamentals, start with the Prometheus and Grafana monitoring tutorial before comparing paid platforms.
What Good Kubernetes Monitoring Must Cover
Kubernetes adds a layer of abstraction between your application and the machines running it. That abstraction is powerful, but it also means a broken user request might be caused by a pod restart, a failed readiness probe, an overloaded node, a throttled container, a bad rollout, a network policy, a database dependency, or a service mesh misconfiguration.
A serious Kubernetes monitoring setup should cover these layers:
- Cluster health: node readiness, API server health, scheduler and controller-manager signals, etcd health when you manage the control plane, and resource pressure.
- Workload health: deployments, daemonsets, statefulsets, pods, containers, restarts, failed scheduling, image pull errors, and readiness or liveness probe failures.
- Resource usage: CPU, memory, network, disk, persistent volumes, limits, requests, throttling, and saturation trends.
- Application telemetry: RED metrics, traces, logs, custom business metrics, error rates, latency percentiles, and dependency timing.
- Events and change context: Kubernetes events, deployment markers, configuration changes, autoscaling decisions, and incident timelines.
- Alert quality: alerts tied to user impact and SLOs, not noisy alerts for every short-lived pod event.
- Cost awareness: unused requests, oversized limits, idle workloads, namespace-level cost, and retention costs for telemetry.
The Kubernetes monitoring tools below approach these problems differently. Some are collection-first. Some are dashboard-first. Some are full observability platforms. The right choice is usually a stack, not a single binary.
Comparison Table: Best Kubernetes Monitoring Tools in 2026
| Tool | Best for | Strengths | Watch-outs | Best fit |
|---|---|---|---|---|
| Prometheus | Open-source metrics and alerting | Kubernetes-native scraping model, PromQL, strong ecosystem | Long-term storage, high availability, and scale need extra design | Platform teams that can operate their own monitoring stack |
| Grafana / Grafana Cloud | Dashboards and managed Prometheus-style observability | Excellent dashboards, broad data-source support, managed Kubernetes monitoring option | Costs depend on usage, active series, logs, traces, host/container hours, and retention | Teams that like open standards but want less operations work |
| OpenTelemetry Collector | Vendor-neutral telemetry collection | Collects and routes metrics, logs, and traces; enriches telemetry with Kubernetes metadata | Not a complete monitoring UI by itself | Teams avoiding vendor lock-in or standardizing instrumentation |
| Datadog | Fast SaaS observability across infrastructure, APM, logs, and security | Polished Kubernetes views, containers explorer, integrations, alerting, APM correlation | Modular pricing can grow quickly with hosts, containers, logs, APM, and add-ons | Mid-size to large teams that value speed and integrated workflows |
| Dynatrace | Enterprise Kubernetes observability and automated root-cause analysis | Topology, relationships, Kubernetes context, OneAgent/Operator model, Davis AI | Enterprise buying process and licensing complexity | Large organizations with many clusters, compliance needs, and incident automation goals |
| New Relic | Unified observability with usage-based data ingest | Kubernetes quickstarts, APM/logs/infrastructure in one place, generous entry tier | User tiers and data ingest need governance as teams scale | Teams that want broad observability without managing Prometheus at scale |
| Elastic Observability | Search-first logs, metrics, traces, and security-adjacent observability | Strong log analytics, flexible deployment, Kubernetes integrations, Kibana dashboards | Cluster sizing and storage lifecycle management matter | Teams already using Elastic or needing self-managed/search-heavy observability |
| Cloud-native tools | Provider-specific monitoring on EKS, AKS, or GKE | Low-friction integration with cloud accounts, managed control-plane visibility | Less portable across clouds and often weaker for app-level traces | Single-cloud teams that want simple operational coverage |
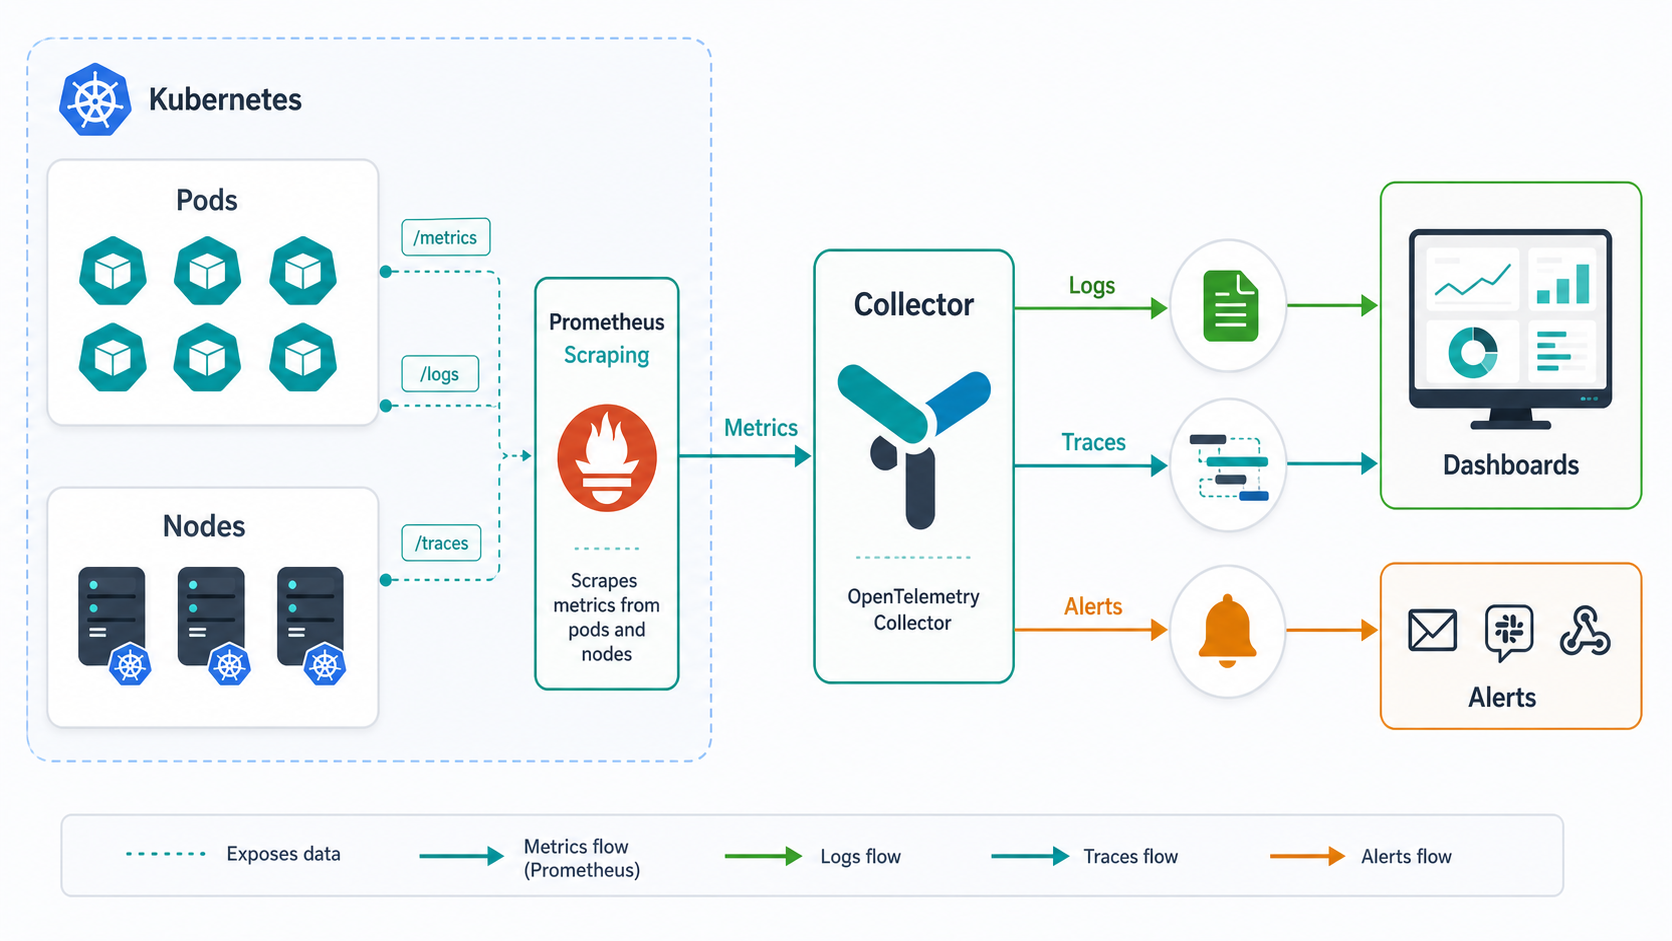
1. Prometheus: Best Open-Source Kubernetes Metrics Foundation
Prometheus remains the default starting point for Kubernetes metrics because its pull-based scraping model, labels, service discovery, and PromQL fit Kubernetes well. It stores metrics as time series with labels, which maps naturally to pods, namespaces, deployments, nodes, and services.
In a typical Kubernetes deployment, you install the kube-prometheus-stack Helm chart, collect cluster metrics from kube-state-metrics and node exporters, scrape application endpoints that expose Prometheus metrics, and send alerts through Alertmanager. For many teams, this is enough to detect common problems such as pod crash loops, failed deployments, CPU throttling, persistent volume pressure, and bad latency trends.
Pros: mature ecosystem, no license fee, excellent Kubernetes fit, powerful PromQL, huge community, and strong compatibility with Grafana.
Cons: you own scaling, retention, storage, high availability, remote write, backup, upgrades, cardinality control, and alert hygiene. Prometheus is excellent, but it is not magically cheap if you assign senior engineers to maintain a large internal observability platform.
Choose Prometheus if: your team can operate Kubernetes confidently, wants open-source control, and is willing to design storage and retention intentionally.
2. Grafana and Grafana Cloud: Best Dashboard and Managed Prometheus Experience
Grafana is the visualization layer many Kubernetes teams expect, whether the backend is Prometheus, Loki, Tempo, Mimir, Elasticsearch, CloudWatch, Azure Monitor, or another source. Grafana Cloud extends that experience into managed metrics, logs, traces, profiles, and Kubernetes Monitoring.
The practical difference is operational responsibility. With self-hosted Grafana and Prometheus, you control the stack but maintain it. With Grafana Cloud, you keep a familiar open-observability workflow while offloading much of the backend work. Grafana’s current Kubernetes Monitoring pricing model includes host and container hour concepts for some plans, while other telemetry types may have their own usage dimensions. That makes cost modeling important before you ship every log line and high-cardinality metric.
Pros: excellent dashboards, strong open-source roots, broad data-source support, useful managed path, and good fit for teams that already know Prometheus.
Cons: dashboard sprawl is real, and managed usage costs need guardrails for labels, logs, trace sampling, and retention.
Choose Grafana Cloud if: you want Prometheus-style Kubernetes monitoring without running all the storage and scaling infrastructure yourself.
3. OpenTelemetry Collector: Best Vendor-Neutral Collection Layer
OpenTelemetry is not a full monitoring product, but it is one of the most important observability decisions you can make in 2026. The OpenTelemetry Collector can receive, process, enrich, and export telemetry to one or more backends. In Kubernetes, it commonly collects OTLP telemetry, kubelet stats, logs from pod files, and metadata through the Kubernetes attributes processor.
This matters because Kubernetes troubleshooting depends on correlation. A trace without namespace, pod, node, deployment, and service metadata is much less useful. OpenTelemetry helps attach that context consistently across logs, metrics, and traces before the data reaches Datadog, Grafana, New Relic, Elastic, Dynatrace, or another backend.
Pros: vendor-neutral, strong ecosystem momentum, good for multi-backend routing, supports logs/metrics/traces, and reduces lock-in at the instrumentation layer.
Cons: configuration can become complex, and you still need a backend for storage, visualization, alerting, and incident workflows.
Choose OpenTelemetry if: you want portable instrumentation, consistent Kubernetes metadata, and the freedom to change backends later.
4. Datadog: Best Integrated SaaS Platform for Kubernetes Teams
Datadog is strong when you want Kubernetes infrastructure, containers, logs, APM, network, security, synthetics, deployment visibility, and alerting in one SaaS platform. It provides Kubernetes and container views, resource utilization, autoscaling insights, workload details, and tight correlation across signals.
The reason teams buy Datadog is speed. You can often get from agent installation to useful dashboards and alerts faster than building an equivalent open-source platform. The tradeoff is pricing discipline. Datadog’s model is modular: infrastructure hosts, containers, APM, logs, synthetics, security, and other capabilities can each affect the bill. Container billing also has plan-specific included container allowances and additional container-hour charges after that.
Pros: fast onboarding, polished UI, strong integrations, good correlation, mature alerting, and broad platform coverage.
Cons: cost can rise quickly with high-cardinality metrics, verbose logs, many containers, broad APM adoption, and add-on products.
Choose Datadog if: reducing incident time and platform assembly work matters more than minimizing license spend.
5. Dynatrace: Best Enterprise Kubernetes Observability and Automation
Dynatrace is built for organizations that need deep topology, relationship mapping, automated context, and enterprise-grade operations across many environments. Its Kubernetes monitoring can connect cluster entities such as pods, namespaces, workloads, and nodes with services, applications, databases, and other dependencies.
Dynatrace is especially relevant when the question is not “can we chart pod CPU?” but “can we understand the blast radius of this change across clusters and services?” The Dynatrace Operator and OneAgent model reduce some manual instrumentation work, and the platform is known for AI-assisted root-cause workflows.
Pros: strong topology, enterprise features, automated discovery, Kubernetes context, and advanced incident analysis.
Cons: buying and licensing can be more complex than self-serve tools, and smaller teams may not use enough of the platform to justify the cost.
Choose Dynatrace if: you operate many clusters, have strict reliability requirements, and need executive-grade observability across services and infrastructure.
6. New Relic: Best Broad Observability Platform With Simple Entry
New Relic provides Kubernetes monitoring quickstarts, infrastructure monitoring, APM, logs, distributed tracing, alerting, and dashboards in one platform. Its pricing model is strongly tied to data ingest and user tiers, which can be attractive when you want flexibility but still requires governance.
New Relic is often a good fit for application teams that want Kubernetes visibility without spending months building an internal monitoring platform. It is also useful when developers need to move between application traces, errors, logs, infrastructure, and service-level indicators from the same workspace.
Pros: easy entry, broad capabilities, good APM workflow, Kubernetes quickstarts, and useful free/low-friction onboarding.
Cons: data ingest, retention, and full-user access can become cost drivers as adoption expands.
Choose New Relic if: you want an integrated developer-friendly observability platform and can manage ingest and user access carefully.
7. Elastic Observability: Best for Search-Heavy Logs and Flexible Deployment
Elastic Observability is compelling when logs are central to your debugging workflow or when your organization already uses Elasticsearch and Kibana. It supports Kubernetes logs, metrics, traces, dashboards, alerting, and SLO workflows, and it can be deployed as Elastic Cloud or self-managed infrastructure.
Elastic’s main advantage is search and investigation. If your incidents often start with “find the pattern across millions of log lines,” Elastic can feel natural. The tradeoff is operational discipline: index lifecycle management, storage sizing, mappings, retention, and shard strategy matter when log volume grows.
Pros: excellent log search, flexible deployment, strong Kibana dashboards, useful security adjacency, and good fit for existing Elastic users.
Cons: storage and indexing choices can become expensive or slow if unmanaged, especially with high-volume Kubernetes logs.
Choose Elastic if: logs and search are your primary troubleshooting workflow, or you already operate Elastic successfully.
8. Cloud-Native Kubernetes Monitoring Tools
If you run only one cloud, the cloud provider’s native monitoring can be enough for the first stage. AWS, Azure, and Google Cloud all offer Kubernetes monitoring integrations around EKS, AKS, and GKE. These tools are usually easiest for platform teams already committed to one cloud billing, IAM, and operational model.
The limitation is portability. Cloud-native monitoring may be weaker when you need consistent dashboards and alerting across multi-cloud, on-prem, edge, or hybrid clusters. It can also leave gaps in deep application traces unless paired with OpenTelemetry or an APM platform.
Choose cloud-native monitoring if: you are single-cloud, early in your Kubernetes journey, and want a low-friction baseline before standardizing on a broader observability stack.
Pricing and Licensing Caveats Buyers Should Check
Observability pricing is hard because Kubernetes is dynamic. Nodes scale up and down. Pods churn. Logs spike during incidents. Labels create high-cardinality metrics. A trace sampling change can multiply ingest. Before choosing a paid platform, model your current and expected usage.
- Host or node pricing: common for infrastructure monitoring, but autoscaling node pools can change the bill.
- Container pricing: some platforms include a number of containers per host and charge for additional containers.
- Data ingest: logs, traces, profiles, and custom metrics often have separate ingest or retention charges.
- Cardinality: labels such as pod UID, request ID, customer ID, and unbounded endpoint names can explode metrics cost.
- Retention: keeping raw logs or high-resolution metrics for months is rarely free.
- User licensing: some platforms charge differently for basic, core, full, admin, or enterprise users.
- Support and enterprise features: SSO, audit logs, advanced RBAC, private connectivity, compliance, and premium support may require higher tiers.
For revenue-sensitive comparisons, do not compare only the advertised starting price. Ask each vendor for an estimate using your actual node count, average container count, log GB/day, trace sampling rate, custom metric volume, retention period, and number of full users.
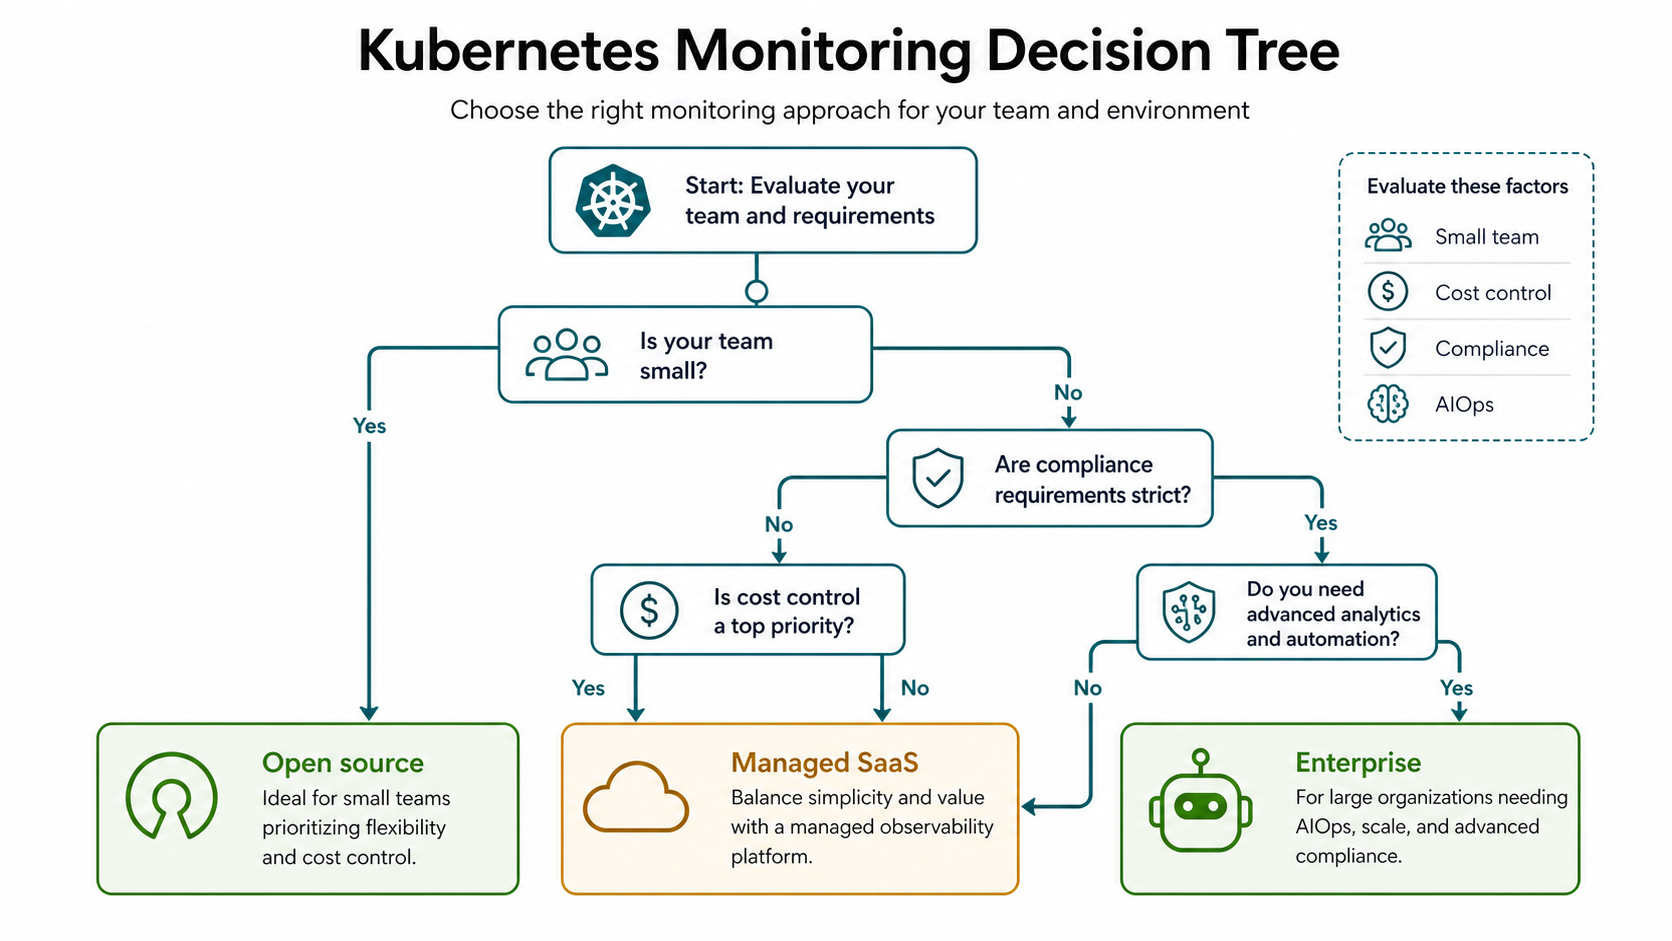
Recommended Tool Choices by Scenario
| Scenario | Recommended choice | Why |
|---|---|---|
| Learning Kubernetes monitoring | Prometheus + Grafana | Teaches the core concepts and gives strong free coverage |
| Small production cluster | Prometheus + Grafana, with managed Grafana if needed | Good balance of control and cost |
| Developer-led SaaS team | Datadog or New Relic | Faster correlation across app, infra, logs, and traces |
| Enterprise with many clusters | Dynatrace or Datadog Enterprise | Topology, governance, support, and automation become important |
| Log-heavy troubleshooting | Elastic Observability | Search, log analytics, and flexible deployment are strengths |
| Vendor-neutral instrumentation | OpenTelemetry Collector plus chosen backend | Keeps telemetry portable and enriches Kubernetes context |
| Single-cloud early-stage team | Cloud-native monitoring plus alerts | Simple setup and integrated billing/IAM |
A Practical Kubernetes Monitoring Rollout Plan
If you are building Kubernetes monitoring from scratch, avoid installing every agent at once. Start with a practical rollout that gives useful coverage without creating noise.
Step 1: Define the incidents you must detect
Write down the top failure modes: failed rollout, pod crash loop, node pressure, elevated latency, 5xx spike, queue backlog, database timeout, DNS failure, and certificate expiry. Monitoring should map to these outcomes.
Step 2: Install cluster metrics first
Start with node, pod, workload, namespace, and persistent volume metrics. For open source, kube-prometheus-stack is a common baseline. For SaaS tools, install the vendor’s Kubernetes agent or Helm chart in a controlled namespace.
Step 3: Add application SLOs
Cluster health matters, but users care about service behavior. Add latency, traffic, errors, saturation, and dependency metrics for important services. Define at least one SLO for your most important API or user workflow.
Step 4: Add logs and traces selectively
Do not stream every debug log forever. Start with structured logs for key services, retention tiers, and trace sampling. Use OpenTelemetry where possible so instrumentation is not tightly coupled to one backend.
Step 5: Tune alerts after real incidents
The first alert rules are guesses. Review every page: was it actionable, urgent, and tied to user impact? Remove noisy alerts, route warning signals to tickets or Slack, and reserve paging for symptoms that require immediate human response.
Common Kubernetes Monitoring Mistakes
- Monitoring only nodes: node CPU is not enough when pods restart, probes fail, or services return errors.
- Ignoring cardinality: unbounded labels can make Prometheus slow and SaaS platforms expensive.
- Paging on symptoms nobody owns: every alert needs an owner and a runbook.
- Collecting logs without structure: plain text logs are harder to query than JSON logs with service, environment, trace ID, and request context.
- Skipping deployment markers: many incidents are caused by changes; monitoring should show what changed and when.
- Using one retention policy for everything: hot troubleshooting data and long-term trend data need different retention strategies.
- Buying before modeling usage: ask vendors to price your real telemetry profile, not a small demo cluster.
Internal Links and Next Reading
Current product and documentation references reviewed for this comparison include the official Prometheus overview, OpenTelemetry Collector for Kubernetes, Grafana Cloud pricing, Datadog Kubernetes documentation, Datadog container billing documentation, Dynatrace Kubernetes setup documentation, New Relic pricing, and Elastic Kubernetes monitoring.
To go deeper, continue with these GravityDevOps resources:
- Prometheus & Grafana: Monitoring Tutorial for hands-on open-source monitoring basics.
- Amazon EKS Tutorial: Kubernetes on AWS for Kubernetes cluster context on AWS.
- Best CI/CD Tools in 2026 for connecting deployments to observability workflows.
- Running LLMs Locally with Ollama if you are monitoring AI workloads on Kubernetes.
- What is Generative AI? for teams building AI systems that also need observability.
Final Recommendation
If you are learning or running a cost-conscious platform, start with Prometheus, Grafana, Alertmanager, and carefully selected logs. If your team is spending more time maintaining monitoring than improving reliability, move the backend to Grafana Cloud or evaluate Datadog/New Relic. If your organization needs enterprise topology, automation, and many-cluster governance, evaluate Dynatrace seriously. If logs are your investigative center of gravity, Elastic deserves a close look.
The best Kubernetes monitoring tool in 2026 is the one your team can operate consistently, afford predictably, and use during a real incident. Fancy dashboards matter less than fast answers to three questions: what changed, what is broken, and who is affected?
FAQ: Kubernetes Monitoring Tools in 2026
What is the best Kubernetes monitoring tool in 2026?
For most technical teams, Prometheus plus Grafana is the best starting point. For managed SaaS observability, Datadog, New Relic, Grafana Cloud, Dynatrace, and Elastic are stronger choices depending on budget, team size, and operational maturity.
Is Prometheus enough for Kubernetes monitoring?
Prometheus is enough for many metrics and alerting needs, especially with Grafana dashboards and Alertmanager. It is not enough by itself for logs, distributed traces, long-term storage, incident workflows, or enterprise governance unless you add supporting tools.
Should I use OpenTelemetry with Kubernetes?
Yes, especially for application telemetry. OpenTelemetry helps standardize traces, metrics, and logs, enriches telemetry with Kubernetes metadata, and gives you more flexibility if you change observability vendors later.
Which Kubernetes monitoring tool is best for small teams?
Small teams should usually start with Prometheus and Grafana or a managed service such as Grafana Cloud, Datadog, or New Relic. The best choice depends on whether you prefer lower software cost or lower operational workload.
Which Kubernetes monitoring tool is best for enterprises?
Dynatrace, Datadog, Elastic, and enterprise Grafana deployments are common enterprise options. Enterprises should evaluate RBAC, SSO, audit logs, compliance, deployment model, support, topology mapping, cost controls, and multi-cluster governance.
How do I control Kubernetes observability costs?
Control costs by limiting high-cardinality labels, setting log retention tiers, sampling traces, filtering noisy telemetry, avoiding debug logs in production, reviewing unused dashboards and alerts, and modeling vendor pricing with your real node, container, log, metric, and user counts.

