SEO excerpt: Compare the best AIOps tools in 2026 for observability, alert correlation, root-cause analysis, incident automation, ITSM integration, and cloud-native operations.
Quick Answer: Best AIOps Tools in 2026
The best AIOps tool in 2026 depends on what problem you are really trying to solve. Choose Dynatrace or Datadog if you want AIOps tightly embedded in full-stack observability. Choose BigPanda or PagerDuty if your biggest pain is incident noise, routing, and event correlation across many tools. Choose IBM Instana, Splunk Observability Cloud, or ServiceNow ITOM when enterprise governance, hybrid infrastructure, and ITSM workflows matter. Choose Grafana Cloud with OpenTelemetry if your team wants flexibility, open standards, and a lower platform-lock-in path.
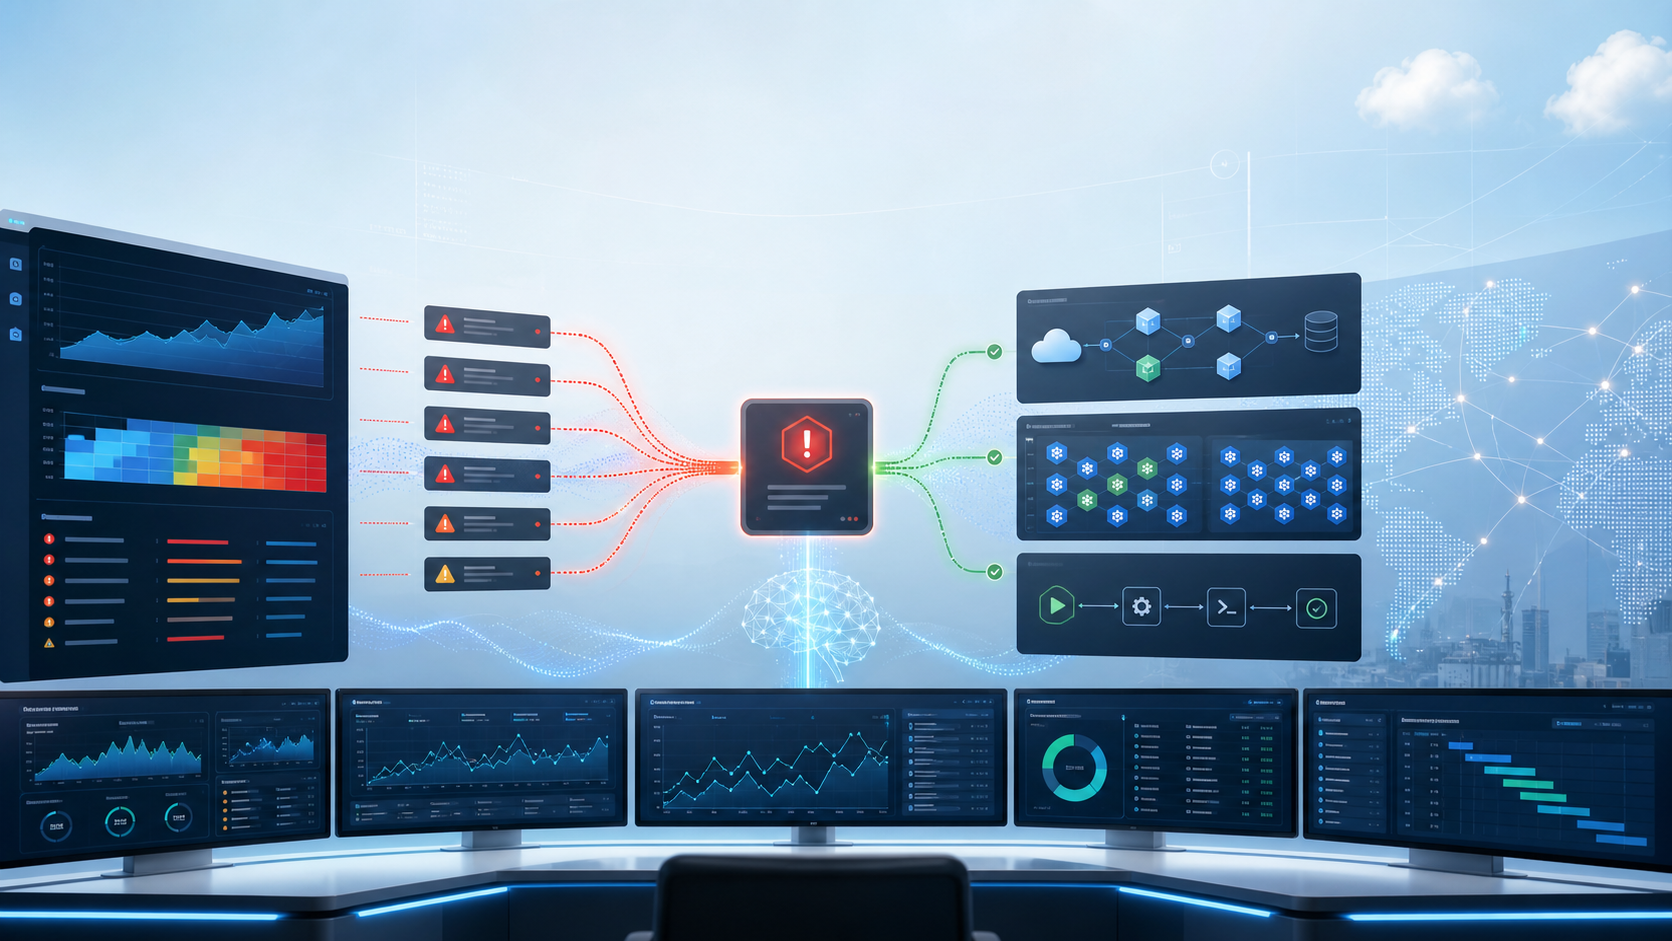
AIOps is not magic monitoring. It is the practical use of machine learning, topology context, event correlation, and automation to reduce alert noise, find probable root cause faster, and trigger safer incident response. The right platform should help your engineers make better decisions during outages, not bury them under another dashboard.
What AIOps Actually Does
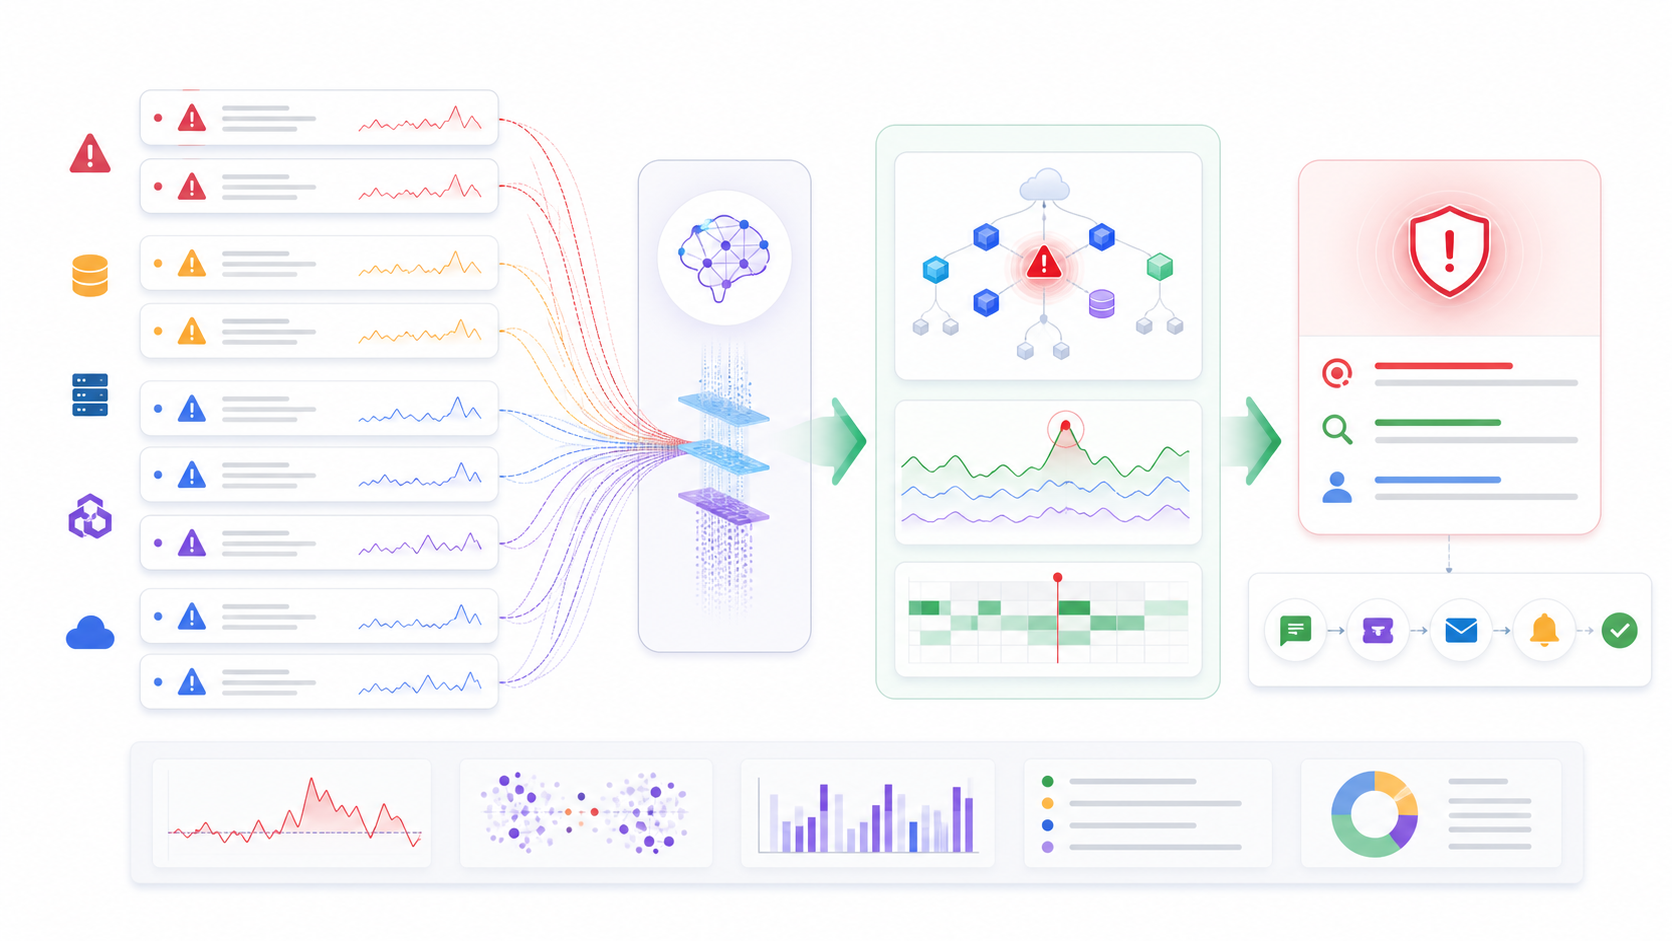
AIOps stands for artificial intelligence for IT operations. In practice, it sits on top of your telemetry and operational workflows: metrics, logs, traces, events, change records, deployment history, service ownership, incidents, and runbooks. The goal is to turn scattered signals into fewer, higher-quality operational decisions.
For a beginner, think of a normal monitoring stack as a smoke alarm. It tells you something is wrong. AIOps tries to answer the next questions: are these ten alerts part of the same incident, which service changed recently, what user journey is affected, who owns the service, what remediation is safe, and what should be escalated?
- Anomaly detection: learn normal patterns and flag behavior that does not match expected baselines.
- Event deduplication: group repeated alerts so on-call engineers do not receive hundreds of equivalent notifications.
- Correlation: connect symptoms across metrics, logs, traces, topology, deployment events, and tickets.
- Probable root cause: suggest the most likely source of the incident, often using dependency maps and causal context.
- Automation: trigger safe diagnostics or remediation runbooks, either automatically or with human approval.
If you are still building your monitoring foundations, start with our Prometheus and Grafana monitoring tutorial. If you are evaluating where AI fits into engineering workflows more broadly, read AI Agents Explained: Agentic AI in 2026 and What Is Generative AI? A Beginner’s Guide.
Best AIOps Tools in 2026: Comparison Table
| Tool | Best For | Strengths | Watch Outs | Pricing Caveat |
|---|---|---|---|---|
| Dynatrace | Enterprise full-stack observability and causal AIOps | Deep topology, Davis AI, Kubernetes, cloud, application, infrastructure, and user-experience context | Can be a larger platform commitment than smaller teams need | Usage-based platform pricing; model carefully before rollout |
| Datadog | Cloud-native engineering teams already centralizing telemetry in Datadog | Watchdog insights, broad integrations, logs, metrics, APM, synthetics, security and incident workflows | Costs can rise quickly with high-cardinality telemetry and broad module adoption | Published product pricing varies by module and usage |
| New Relic | Teams that want observability plus AI assistance in one platform | Telemetry platform, APM, logs, infrastructure, AI-assisted investigation, generous entry path | Governance and cost controls still matter at scale | Pricing depends on data ingest and user model |
| BigPanda | Event correlation across many monitoring tools | Noise reduction, incident intelligence, topology enrichment, ITSM integrations | Works best when your upstream alerts and ownership data are clean | Enterprise quote-based pricing is common |
| PagerDuty | Incident response automation and on-call operations | Event orchestration, service ownership, escalation, automation actions, incident workflows | Not a full replacement for observability telemetry | Plan and add-on costs depend on users and capabilities |
| IBM Instana | Hybrid enterprise application performance and dependency mapping | Automatic discovery, tracing, infrastructure and application context, enterprise support | May fit IBM-heavy or regulated enterprises better than lean startups | Commercial pricing requires workload planning |
| Splunk Observability Cloud | Enterprises using Splunk for logs, security, and operational analytics | Metrics, traces, logs, real-time analytics, strong enterprise ecosystem | Licensing and data volume planning are essential | Pricing can vary significantly by data volume and packaging |
| ServiceNow ITOM | IT operations tightly connected to CMDB and ITSM workflows | Service mapping, event management, change and incident process integration | Requires process maturity and CMDB discipline | Enterprise licensing usually needs direct planning |
| Grafana Cloud plus OpenTelemetry | Open telemetry strategy and flexible observability foundations | Prometheus, Loki, Tempo, Mimir, dashboards, alerts, open standards | Advanced AIOps behavior may require more engineering and integrations | Usage-based cloud plans; self-managed options shift cost to operations |
1. Dynatrace
Dynatrace is one of the strongest AIOps choices when your environment is complex enough that topology and causality matter. Its Davis AI approach is built around understanding relationships between applications, services, infrastructure, Kubernetes, user journeys, and cloud dependencies. That makes it useful for teams that need more than isolated alerts.
Best fit: medium to large engineering organizations running cloud-native, hybrid, or enterprise applications where root-cause analysis must account for many service dependencies.
- Pros: strong automatic discovery, deep dependency mapping, mature enterprise observability, good fit for Kubernetes and complex applications.
- Cons: platform depth can be more than a small team needs, and usage-based pricing requires careful forecasting.
- Buy when: you want one strategic observability and AIOps platform, not a collection of point tools.
2. Datadog
Datadog Watchdog and Datadog’s broader observability platform are a strong fit for teams already using Datadog for metrics, logs, APM, infrastructure monitoring, synthetics, real user monitoring, cloud security, and incident workflows. The biggest advantage is operational breadth: your telemetry, alerts, dashboards, services, and incident context can live in the same ecosystem.
Best fit: cloud-native teams that want AIOps capabilities close to their day-to-day dashboards, monitors, traces, and service catalog.
- Pros: excellent integrations, fast adoption, strong developer experience, useful anomaly and insight features.
- Cons: costs can increase as teams add modules, retain more logs, or emit high-cardinality telemetry.
- Buy when: Datadog is already your operational control plane and your team wants less tool switching during incidents.
3. New Relic
New Relic AI brings AI-assisted investigation into a platform many teams already know for application performance monitoring and telemetry analysis. It can be especially useful for teams that want practical help exploring telemetry, summarizing issues, and accelerating investigation without rebuilding their entire observability practice.
Best fit: engineering teams that want a developer-friendly observability platform with AI assistance and a relatively approachable adoption curve.
- Pros: approachable telemetry platform, AI-assisted troubleshooting, good APM heritage, useful for teams standardizing observability.
- Cons: teams still need good instrumentation, alert design, and ownership metadata for the AI layer to be useful.
- Buy when: you want a practical observability platform with AI guidance rather than a heavyweight IT operations suite.
4. BigPanda
BigPanda is best understood as an incident intelligence and event correlation platform. It is valuable when you already have many monitoring systems and the operational pain is not lack of alerts, but too many low-context alerts. BigPanda can sit between monitoring tools and incident workflows, grouping related events into more useful incidents.
Best fit: enterprises with fragmented monitoring tools, noisy alert streams, and mature incident management processes.
- Pros: strong alert noise reduction, correlation, enrichment, and ITSM-oriented workflows.
- Cons: correlation quality depends on clean event data, ownership, topology, and change context.
- Buy when: your monitoring stack is staying heterogeneous and you need an intelligence layer above it.
5. PagerDuty
PagerDuty AIOps is a strong option when your primary problem is incident response: event routing, service ownership, escalation, noise reduction, automation, and on-call coordination. PagerDuty is not the same thing as a metrics or tracing backend. It shines when it connects signal quality to human and automated response.
Best fit: SRE, platform, and operations teams that need better incident routing and response automation across existing telemetry tools.
- Pros: strong incident workflows, on-call maturity, event orchestration, automation actions, and service ownership model.
- Cons: you still need reliable observability data from monitoring and tracing systems.
- Buy when: the biggest incident bottleneck is triage, escalation, and coordinated response.
6. IBM Instana
IBM Instana focuses on automatic application observability, dependency discovery, tracing, and hybrid infrastructure context. It is worth considering for enterprises that need strong application performance visibility and support-backed operations across modern and legacy environments.
Best fit: enterprises running complex application estates, especially where hybrid infrastructure, governance, and vendor support matter.
- Pros: automatic discovery, application dependency context, tracing, enterprise support, useful hybrid visibility.
- Cons: may feel heavy for smaller product teams that only need cloud-native observability basics.
- Buy when: your organization values enterprise observability support and deep application dependency context.
7. Splunk Observability Cloud
Splunk Observability Cloud is a natural candidate for organizations already invested in Splunk for operational analytics, logs, or security workflows. It can combine metrics, traces, logs, and analytics for engineering and operations teams that need enterprise scale.
Best fit: enterprises that want observability connected to broader Splunk analytics and security operations.
- Pros: strong analytics ecosystem, real-time observability, enterprise adoption, useful fit for Splunk-heavy environments.
- Cons: cost modeling and data governance are critical because telemetry volume can grow quickly.
- Buy when: Splunk is already strategic and you want operations, observability, and analytics closer together.
8. ServiceNow ITOM
ServiceNow IT Operations Management is different from developer-first observability tools. Its strength is tying events, service mapping, CMDB context, incidents, changes, and enterprise workflows together. That can be powerful in organizations where operations process discipline is already strong.
Best fit: large IT organizations that need event management, service mapping, CMDB alignment, and ITSM automation in one enterprise workflow system.
- Pros: excellent workflow integration, strong enterprise process alignment, useful for change and incident management.
- Cons: depends heavily on CMDB quality and process maturity.
- Buy when: operational governance and ITSM integration are as important as technical telemetry.
9. Grafana Cloud and OpenTelemetry
Grafana Cloud is not always marketed as a classic enterprise AIOps platform, but it belongs in the conversation because many teams want open telemetry foundations before they buy proprietary intelligence layers. Grafana Cloud combines managed Prometheus, Loki, Tempo, dashboards, alerting, and integrations, while OpenTelemetry helps reduce instrumentation lock-in.
Best fit: teams that want strong observability foundations, open standards, and flexibility before committing to a large AIOps platform.
- Pros: open ecosystem, familiar dashboards, flexible telemetry strategy, good fit for Prometheus users.
- Cons: advanced root-cause automation and enterprise event correlation may need extra tooling or custom work.
- Buy when: you want to keep telemetry portable and build AIOps capability incrementally.
How to Choose an AIOps Tool
Do not start by asking which vendor has the most AI features. Start with the operational failure mode you need to fix. AIOps tools succeed when they are mapped to a real workflow: noisy alerts, slow incident triage, unclear service ownership, weak deployment context, expensive telemetry, or manual remediation.
- Map your signal sources. List where metrics, logs, traces, deployment events, cloud events, Kubernetes events, tickets, and runbooks live today.
- Measure alert noise. Count duplicate alerts, non-actionable pages, alert storms, and incidents with unclear ownership.
- Define your must-have integrations. Common examples include Kubernetes, AWS, Azure, Google Cloud, GitHub Actions, Jenkins, Jira, ServiceNow, Slack, Teams, PagerDuty, and CI/CD pipelines. For CI/CD context, see our Best CI/CD Tools 2026 comparison.
- Test real incidents. A demo dataset is not enough. Replay past incidents or run a proof of concept against production-like telemetry.
- Check explainability. Engineers need to understand why a platform grouped alerts or suggested a root cause.
- Model pricing at real scale. Include hosts, containers, functions, custom metrics, logs, retention, indexed events, users, and add-on modules.
- Require automation guardrails. Auto-remediation should begin with diagnostics and low-risk runbooks before touching production state.
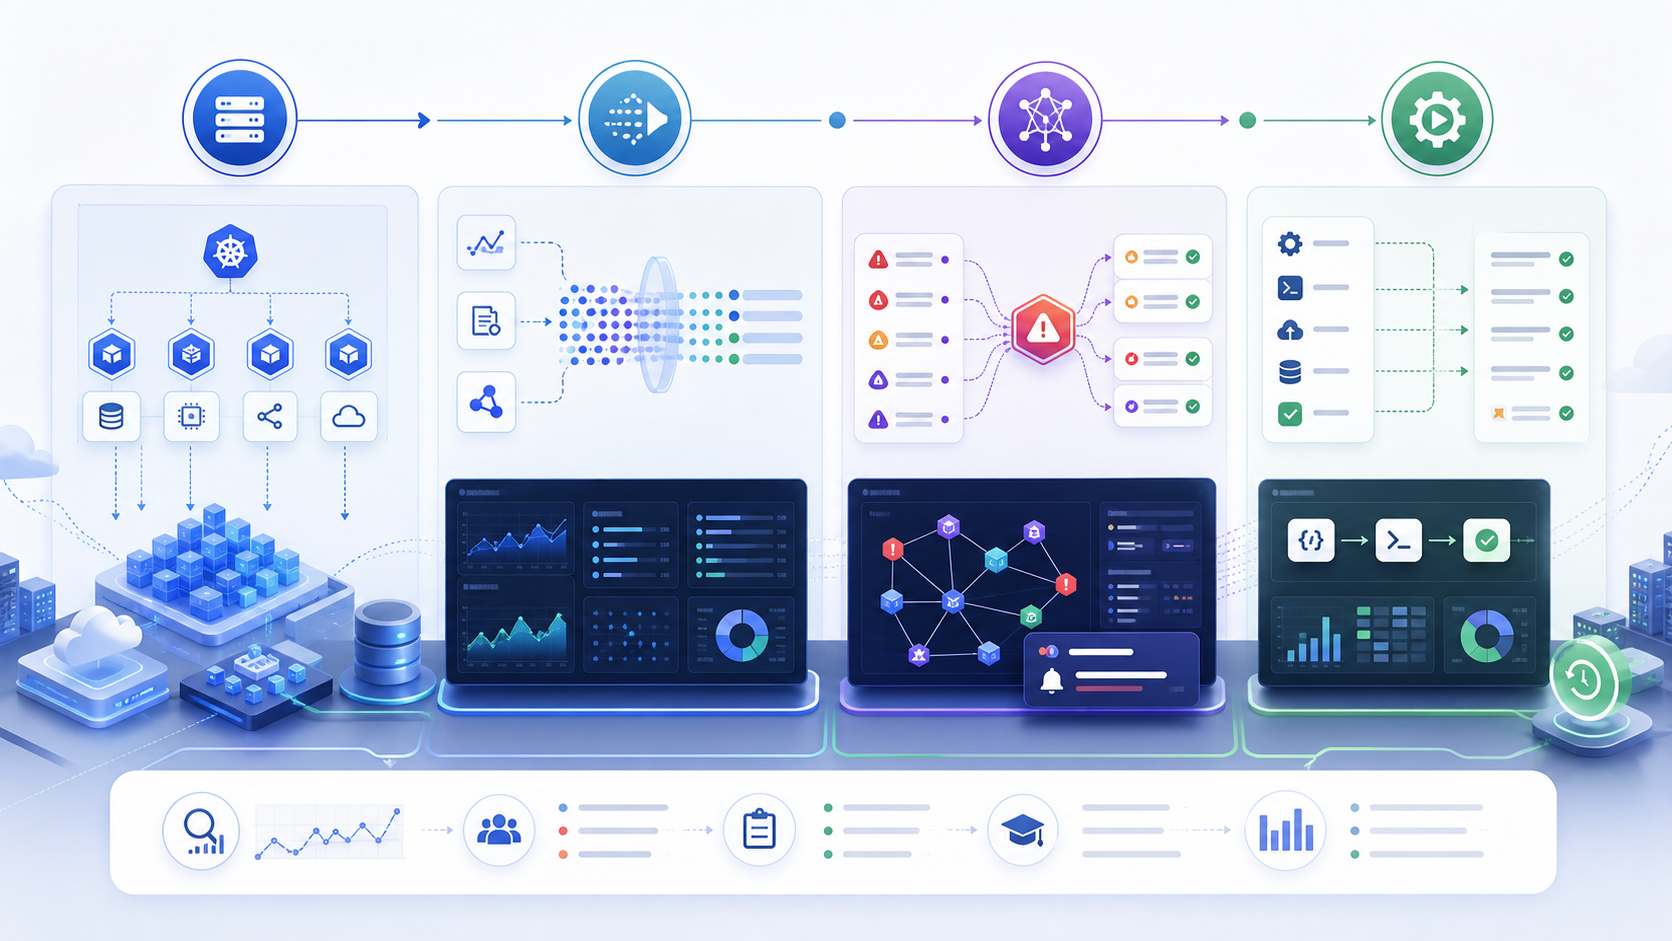
A Practical AIOps Implementation Roadmap
A good AIOps rollout is usually incremental. Teams that try to automate everything immediately often lose trust. A better approach is to improve signal quality first, then add correlation, then add guided automation.
Stage 1: Fix Telemetry Hygiene
Standardize service names, environments, owners, severity labels, trace IDs, deployment markers, and Kubernetes metadata. If your alerts do not know which service owns them, AIOps will not solve the ownership problem for you.
Stage 2: Reduce Alert Noise
Start with deduplication and suppression rules for known non-actionable alerts. Then test event correlation against past incidents. The goal is fewer pages with better context, not fewer alerts hidden from view.
Stage 3: Add Root-Cause Context
Connect topology, deployments, changes, traces, and logs. During an outage, engineers should see that a checkout latency spike began after a database migration or a Kubernetes rollout, not just that five dashboards turned red.
Stage 4: Automate Safely
Begin with read-only diagnostics: collect logs, capture thread dumps, query recent deployments, check pod restarts, or open a war-room channel. Move to remediation only after you have approval gates, rollback paths, audit logs, and clear service ownership.
Pricing and Licensing Caveats
AIOps pricing is difficult because it often follows telemetry scale, product modules, hosts, containers, indexed data, users, incident volume, or enterprise packaging. Before choosing a vendor, build a 12-month cost model with your expected growth in services, Kubernetes clusters, log volume, traces, custom metrics, retention, and users.
Pay special attention to high-cardinality metrics, verbose logs, long retention, per-host agents, per-seat licensing, and add-ons such as synthetics, security, incident intelligence, automation, or advanced analytics. A tool that looks cheaper in a small proof of concept may become expensive after all teams onboard.
Common Mistakes to Avoid
- Buying AIOps before fixing alerts: noisy, low-quality alerts become noisy, low-quality AI inputs.
- Ignoring ownership: every service needs an owner, escalation path, and runbook.
- Skipping deployment context: many incidents are caused by recent changes, so CI/CD and change events must be visible.
- Trusting black-box root cause: engineers need evidence, not unexplained guesses.
- Automating risky actions too early: start with diagnostics and human approval.
- Underestimating data cost: logs, traces, and metrics can grow faster than planned.
Neutral Recommendations
If you are a small cloud-native team, start with strong observability fundamentals: OpenTelemetry, Prometheus, Grafana, logs, traces, clear alerting, and incident hygiene. Add AIOps features when the operational pain is measurable.
If you are a scaling SaaS company, shortlist Datadog, New Relic, Dynatrace, Grafana Cloud, and PagerDuty depending on whether observability or incident response is the bigger bottleneck. Run a proof of concept against real incidents and model costs before expanding.
If you are an enterprise with hybrid infrastructure, many monitoring tools, ITSM requirements, and strict governance, evaluate Dynatrace, BigPanda, ServiceNow ITOM, IBM Instana, Splunk Observability Cloud, and PagerDuty. Your decision should weigh process integration and ownership maturity as heavily as AI features.
FAQ: Best AIOps Tools in 2026
What is the best AIOps tool in 2026?
There is no single best AIOps tool for every team. Dynatrace is strong for full-stack observability with causal analysis, Datadog is strong for cloud-native teams already using Datadog telemetry, BigPanda is strong for event correlation across fragmented toolchains, PagerDuty is strong for incident automation, and Grafana Cloud is strong for teams that want open telemetry and flexible dashboards.
Do small teams need AIOps?
Small teams usually do not need a large enterprise AIOps platform on day one. They should first standardize metrics, logs, traces, alerts, ownership, and runbooks. AIOps becomes valuable when alert noise, service dependencies, and incident volume are high enough that humans are spending too much time triaging symptoms.
Is AIOps the same as observability?
No. Observability helps teams understand system behavior using metrics, logs, traces, profiles, events, and topology. AIOps applies machine learning and automation to that telemetry so teams can detect anomalies, correlate alerts, infer probable causes, route incidents, and trigger safe response workflows.
Can open-source tools replace AIOps platforms?
Open-source tools can cover monitoring, alerting, dashboards, and parts of incident response, especially with Prometheus, Grafana, OpenTelemetry, and Alertmanager. They usually require more engineering work to deliver enterprise-style event correlation, topology-aware root-cause analysis, governed automation, and support-backed operations.
What should I test in an AIOps proof of concept?
Test ingestion coverage, alert deduplication, correlation quality, topology accuracy, root-cause explainability, integration with CI/CD and ITSM tools, automation guardrails, pricing at your real telemetry volume, and whether on-call engineers trust the recommendations during real incidents.
Schema-Ready FAQ Structure
{
  "@context": "https://schema.org",
  "@type": "FAQPage",
  "mainEntity": [
    {
      "@type": "Question",
      "name": "What is the best AIOps tool in 2026?",
      "acceptedAnswer": {
        "@type": "Answer",
        "text": "There is no single best AIOps tool for every team. Dynatrace is strong for full-stack observability with causal analysis, Datadog is strong for cloud-native teams already using Datadog telemetry, BigPanda is strong for event correlation across fragmented toolchains, PagerDuty is strong for incident automation, and Grafana Cloud is strong for teams that want open telemetry and flexible dashboards."
      }
    },
    {
      "@type": "Question",
      "name": "Do small teams need AIOps?",
      "acceptedAnswer": {
        "@type": "Answer",
        "text": "Small teams usually do not need a large enterprise AIOps platform on day one. They should first standardize metrics, logs, traces, alerts, ownership, and runbooks. AIOps becomes valuable when alert noise, service dependencies, and incident volume are high enough that humans are spending too much time triaging symptoms."
      }
    },
    {
      "@type": "Question",
      "name": "Is AIOps the same as observability?",
      "acceptedAnswer": {
        "@type": "Answer",
        "text": "No. Observability helps teams understand system behavior using metrics, logs, traces, profiles, events, and topology. AIOps applies machine learning and automation to that telemetry so teams can detect anomalies, correlate alerts, infer probable causes, route incidents, and trigger safe response workflows."
      }
    },
    {
      "@type": "Question",
      "name": "Can open-source tools replace AIOps platforms?",
      "acceptedAnswer": {
        "@type": "Answer",
        "text": "Open-source tools can cover monitoring, alerting, dashboards, and parts of incident response, especially with Prometheus, Grafana, OpenTelemetry, and Alertmanager. They usually require more engineering work to deliver enterprise-style event correlation, topology-aware root-cause analysis, governed automation, and support-backed operations."
      }
    },
    {
      "@type": "Question",
      "name": "What should I test in an AIOps proof of concept?",
      "acceptedAnswer": {
        "@type": "Answer",
        "text": "Test ingestion coverage, alert deduplication, correlation quality, topology accuracy, root-cause explainability, integration with CI/CD and ITSM tools, automation guardrails, pricing at your real telemetry volume, and whether on-call engineers trust the recommendations during real incidents."
      }
    }
  ]
}
Internal Link Suggestions
- Prometheus & Grafana: Monitoring Tutorial for teams building observability foundations before AIOps.
- Best CI/CD Tools 2026 Compared for connecting deployment context to incident analysis.
- AI Agents Explained: Agentic AI in 2026 for understanding how agentic workflows relate to operations automation.
- What Is Generative AI? A Beginner’s Guide for readers new to modern AI concepts.

