

Direct answer: The best AI tools to turn data into reports are DataLab for reproducible analysis, Bricks for a fast designed report, Julius AI for conversational investigation, ChatGPT for flexible one-off briefs, Claude for narrative review, and Microsoft 365 Copilot Analyst for governed workplace data. Every result still needs numerical and editorial review.
An AI report generator should do more than turn a spreadsheet into attractive charts. A useful report explains the question, documents the calculations, presents evidence, separates findings from interpretation and produces something another person can review. That is a different job from monitoring a live dashboard.
This comparison was checked on August 27, 2026 using current US-facing product, pricing, help and privacy pages. Plans and usage limits can change. The review is documentation-based: we compared published capabilities and constraints, but did not create paid accounts or claim hands-on output-quality testing.
If you need a continuously refreshed visual rather than a written readout, see our comparison of AI tools for charts and dashboards. For readers new to the underlying systems, our beginner’s guide to generative AI explains how prompt-driven models produce drafts.
Best AI tools to turn data into reports
| Tool | Best for | Report output | Lowest practical access | Main limitation |
|---|---|---|---|---|
| DataLab | Reproducible analytical reports | Shareable report backed by Python, R or SQL | Free Starter: 3 workbooks and 20 AI prompts | Free-plan data may be eligible for model training; code review helps but requires care |
| Bricks | Fast client-ready visual reports | Designed report, PDF, PowerPoint or share link | Free: 20 AI messages per month; verify export access | Official pages are inconsistent about which exports are included on Free |
| Julius AI | Conversational analysis and follow-ups | Notebook, charts and PDF, CSV or image export | Free plan with daily-refresh credits | The numerical free allowance is not published; scheduled reports require Business |
| ChatGPT | Flexible one-off management briefs | Narrative, tables, charts and downloadable files | Free with separate file and analysis limits | Not a governed recurring-report system; consumer data controls need review |
| Claude | Clear narrative and critical review | Long-form draft, artifact or supported generated file | Free with variable usage limits | Native Office and PDF creation depends on current plan and feature access |
| Microsoft 365 Copilot Analyst | Enterprise Microsoft 365 data | Readable report with charts, tables and visible Python work | Paid Microsoft 365 Copilot license | Requires a qualifying Microsoft 365 plan and admin-controlled availability |
How we ranked them: We screened nine widely available products—DataLab, Bricks, Julius AI, ChatGPT, Claude, Microsoft 365 Copilot Analyst, Gemini, Rows and Zoho Analytics. We compared supported data sources, visible calculations, narrative quality, chart and table support, editing, export, repeatability, published free or paid limits, privacy controls and the ease of checking a claim against the source data. We selected six that offer a credible path from structured data to an explanatory report. Gemini remains useful in Google Workspace, while Rows and Zoho are stronger fits for the live-dashboard intent already covered separately.
1. DataLab: best for reproducible analytical reports
DataCamp DataLab combines an AI chat, a hosted data notebook and a report view. It can begin with an uploaded file or database connection, generate Python, R or SQL, and place the resulting calculations, charts and written explanation in a shareable workbook. That visible computational layer makes it the strongest choice here when a reviewer must inspect how a number was produced.
The DataLab Starter plan is free indefinitely. Its published limits include three workbooks, 20 AI Assistant prompts, 4 GB of RAM and as much as 5 GB of files in one workbook. A session closes after 30 minutes of inactivity and, for security, after six hours even if active. Those limits are enough for a small monthly analysis, but the 20-prompt allowance encourages users to define the report before asking the assistant to iterate.
Why it ranks first: a report can keep the query, transformation, chart and explanation together. That makes reconciliation and reruns easier than accepting a detached paragraph from a chat window.
Limitation: the privacy boundary deserves prominent attention. DataCamp’s current AI model-training opt-out guidance says Free and DataCamp Donates subscribers are not eligible for its opt-out, while Enterprise subscribers are opted out by default. Do not upload confidential customer, employee or financial data to Starter without an approved data-handling review.
2. Bricks: best for a fast designed report
Bricks is the most direct choice when the desired output is a polished read-ahead rather than a notebook. Upload a CSV, XLSX, PDF or image, ask for a report, then edit the generated KPI blocks, charts, tables and written insights. The result can be shared by link or exported as PDF or PowerPoint.
The Free plan currently includes 20 AI messages per month. Bricks defines a message as a request to create or change a dashboard, chart, visualization, analysis or report. Its import documentation says an individual file must be under 25 MB and no more than 100,000 rows; CSV and XLSX imports do not consume an AI credit, while PDF pages and images do. Bricks says a free user can keep manually editing and exporting existing work after the AI allowance is exhausted, but its official pages are inconsistent about whether PDF export is included on Free or begins with Premium. Check the export control in your account before building a client deliverable.
Why it ranks here: it minimizes the design work between an analysis and a deliverable. That is valuable for a weekly operating review, a client summary or a simple board pre-read where layout matters.
Limitation: a visually complete page can hide a weak metric definition. Bricks can draft calculations and insights, but the user should require a reconciliation table and verify every denominator, date filter and comparison period. Its current privacy summary says user content is not used to train public or third-party AI models; organizations should still review retention, subprocessors and contract terms before uploading regulated data.
3. Julius AI: best for conversational investigation
Julius AI is designed for asking follow-up questions of files and connected data. It can write and run code, build charts, preserve work in Notebooks and turn an analysis thread into a shareable report. Its product guidance distinguishes reports from dashboards: reports add historical context and written explanation, while dashboards prioritize current monitoring.
The Julius pricing page lists a $0 plan with daily-refresh credits, Notebooks, a Google Drive connector and 2 GB of RAM. It does not state a stable numerical daily allowance. Paid plans publish monthly credit pools, more models and higher compute; scheduled report runs appear on the Business tier rather than Free. Julius documentation also describes PDF, CSV and PNG exports for analysis outputs.
Why it ranks here: the conversation can move from “show the variance” to “explain the largest driver” and then “package the approved findings.” That is a natural workflow for exploratory reporting.
Limitation: the free capacity is not predictable enough for a promised reporting calendar. Julius’s privacy and data-security page says files and outputs are stored and processed in the United States and are not used to train models, but the user must request or initiate deletion when the work is finished.
4. ChatGPT: best for flexible one-off briefs
ChatGPT data analysis can inspect spreadsheets and CSV files, clean data, run calculations and create tables or charts. It is useful when the final deliverable is a custom management brief: an executive summary, a short methodology, a findings section, supporting visuals and a list of unresolved questions.
Free access is real but constrained. OpenAI’s current file-upload FAQ lists up to three uploads a day for Free users, a hard 512 MB ceiling for any file and an approximate 50 MB ceiling for CSV or spreadsheet files. Data analysis and file uploads have limits separate from the main chat allowance, and those limits can change. The plan comparison also marks interactive tables and charts as unavailable on Free.
Why it ranks here: it is flexible about format and can expose the code used for a calculation, making it useful for drafting a tailored report and checking a specific analytical question.
Limitation: a chat is not a maintained reporting pipeline. On consumer plans, uploaded content may be used to improve models if “Improve the model for everyone” is enabled; turn that control off or use an approved business workspace for sensitive work. Recalculate headline figures outside the generated prose before circulation.
5. Claude: best for narrative and critical review
Claude supports CSV and XLSX analysis, although XLSX requires the analysis tool to be enabled. Anthropic lists a 30 MB limit per file and up to 20 files in a chat. Claude can draft a long-form explanation, maintain a report as an Artifact and provide a downloadable result where the relevant file-creation feature is available.
The Free plan costs $0 and is described as limited, while Pro is $20 per month in the United States. Anthropic does not promise one fixed message count because file size, conversation length, model and tool use all affect consumption. Full Office and PDF creation has rolled out separately from ordinary chat, so confirm the feature and export format in the account before choosing Claude for a deadline.
Why it is included: Claude is a useful second-pass editor when the first analysis exists but the report needs clearer qualifications, a stronger distinction between evidence and interpretation, or a challenge to unsupported recommendations.
Limitation: polished prose can still make a mistaken calculation sound settled. Use Claude to interrogate the analysis, not to certify it. Consumer users should also review the current model-training preference; Anthropic says chats are used for improvement when the user opts in or in limited safety-review circumstances.
6. Microsoft 365 Copilot Analyst: best for governed Microsoft data
Microsoft 365 Copilot Analyst accepts attached Excel files, CSV files and cloud content, runs analytical work and returns an easy-to-read report with charts and tables. Microsoft says users can inspect the Python code Analyst runs. That is valuable when the inputs already live in OneDrive or SharePoint and the organization needs existing identity, permissions and compliance controls to follow the work.
This is not a free consumer tool. The current Microsoft 365 Copilot price is $30 per user per month with annual payment, and a qualifying Microsoft 365 plan is required. Analyst may also be unavailable if an administrator has not enabled the agent, and service or usage limits can apply.
Why it is included: it offers the strongest governance story in this list for an existing Microsoft 365 tenant. Microsoft states that prompts, responses and Microsoft Graph data in Microsoft 365 Copilot are not used to train foundation models.
Limitation: Copilot respects existing permissions, including permissions that may already be too broad. Before deployment, audit overshared SharePoint and OneDrive content, define approved data sources and test the report with a user who has only the intended access.
How to choose an AI report generator
- Choose DataLab when reproducibility and visible code matter more than instant design.
- Choose Bricks when a bounded spreadsheet must become a polished PDF or PowerPoint quickly.
- Choose Julius when the analyst needs to ask several follow-up questions before settling the story.
- Choose ChatGPT or Claude for a flexible one-off brief, critique or narrative layer—not an unattended reporting system.
- Choose Microsoft Analyst when data governance and Microsoft 365 context justify the license and setup.
No tool should be selected only because its first chart looks good. Independent spreadsheet benchmarks continue to show that current AI systems struggle with real-world workbook manipulation and multi-step logic. SpreadsheetBench 2, for example, evaluates end-to-end business workflows across complex multi-sheet workbooks rather than simple table questions. The practical implication is to keep deterministic calculations and source reconciliation in the reporting process.
A safer workflow from data to report
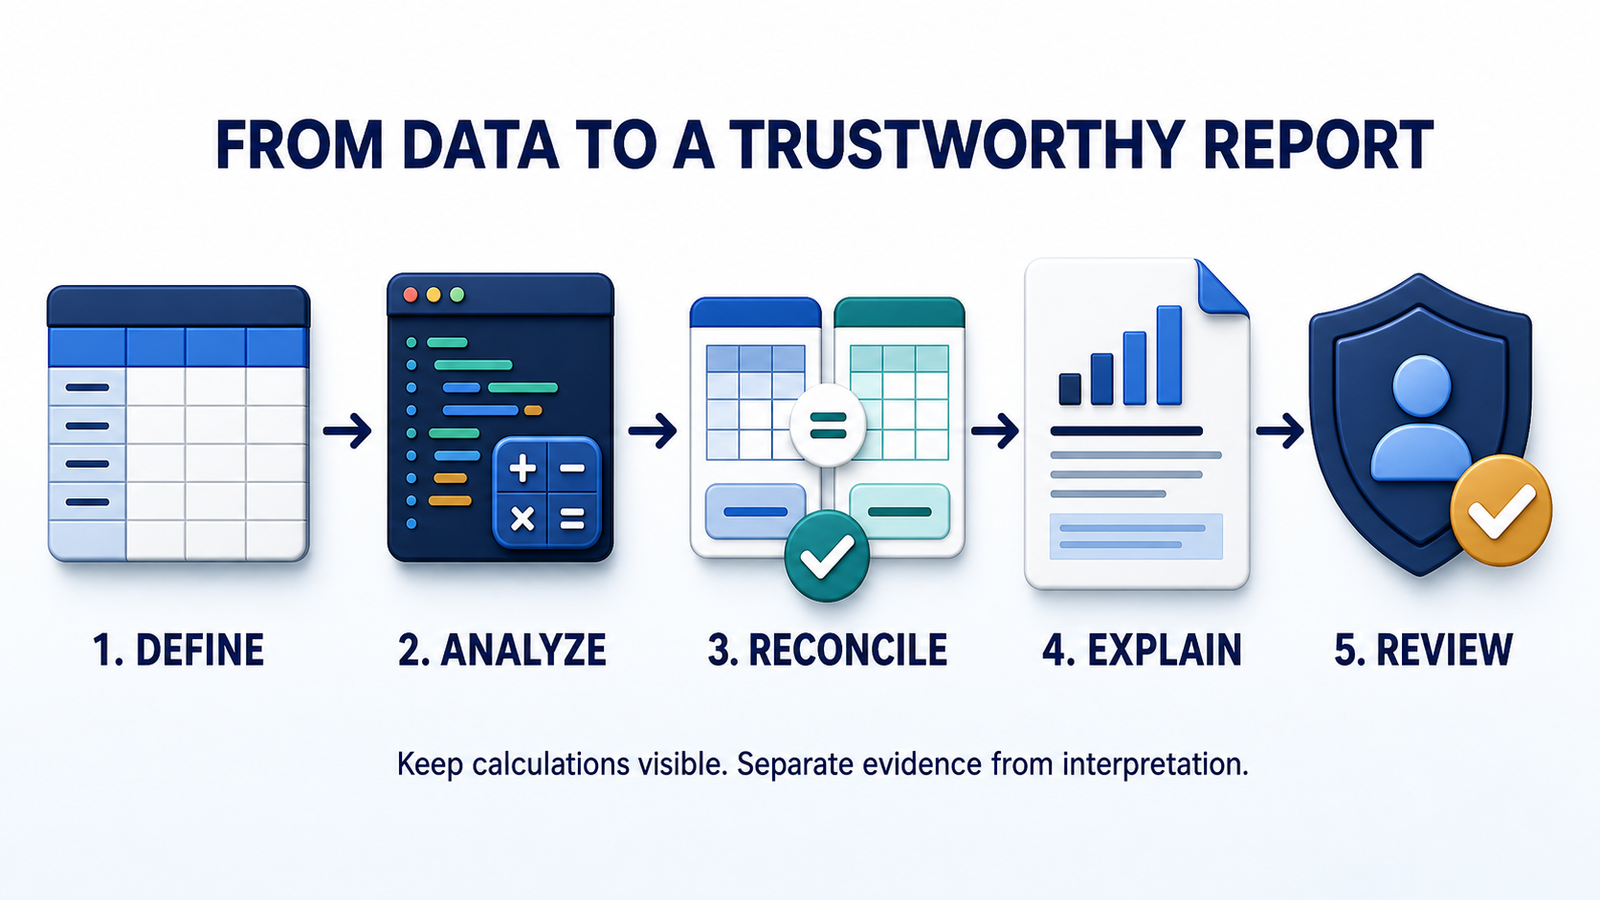
- Define the decision. State who will read the report, what decision it supports and which claims must be answered.
- Create a data dictionary. Explain every metric, date field, unit, exclusion and join key. Our prompt-engineering guide shows why explicit constraints reduce ambiguity.
- Ask for an analysis plan first. Require the tool to list transformations and tests before writing conclusions.
- Reconcile the numbers. Compare record counts, totals and two or three sampled rows against the source. Preserve queries or code.
- Separate evidence from interpretation. Label observed results, possible explanations, assumptions and recommended actions.
- Review access and retention. Remove unnecessary personal data, confirm who can open the report and delete uploads when the project ends.
- Monitor recurring work. If the report becomes a production process, add versioning, evaluation and change controls. Our LLMOps guide explains why generated outputs need ongoing checks.
A practical request might say: “Using the Orders and Targets sheets, produce a monthly performance report for the operations team. Define revenue, gross margin and on-time delivery before calculating them. Exclude canceled orders, use Order Date, reconcile total revenue to the source, show year-over-year change and list missing values. Separate confirmed findings from possible explanations and include a table of every formula used.”
For reports grounded in company documents as well as tables, retrieval permissions matter as much as the model. Our guide to retrieval-augmented generation explains why citations and access controls need to travel with the answer.
Frequently asked questions
Can AI create a report from an Excel or CSV file?
Yes. All six selected tools can analyze tabular data, although supported formats, file sizes and exports differ. A credible workflow keeps the original file, records transformations and checks totals before distributing the report.
What is the best free AI tool for data reports?
DataLab offers the strongest reproducible free workflow, while Bricks is faster for a designed PDF or PowerPoint and includes 20 AI messages per month. The privacy tradeoff is material: DataLab Free users are not eligible for its model-training opt-out, so Bricks may be the safer starting point for non-public data after a terms review.
Can an AI-generated report be used for financial or executive decisions?
Only as a draft that receives qualified human review. Confirm formulas, accounting definitions, source completeness, material assumptions and access controls. Never treat a fluent narrative as evidence that the underlying calculation is correct.
Bottom line
Use DataLab when you need a reproducible report with visible analytical work, or Bricks when you need a polished visual deliverable quickly. Julius is strong for iterative investigation; ChatGPT and Claude are flexible drafting and review tools; Microsoft Analyst fits organizations already governed through Microsoft 365. Whichever tool you choose, make reconciliation, privacy review and human sign-off part of the report—not an afterthought.


