

Quick Answer
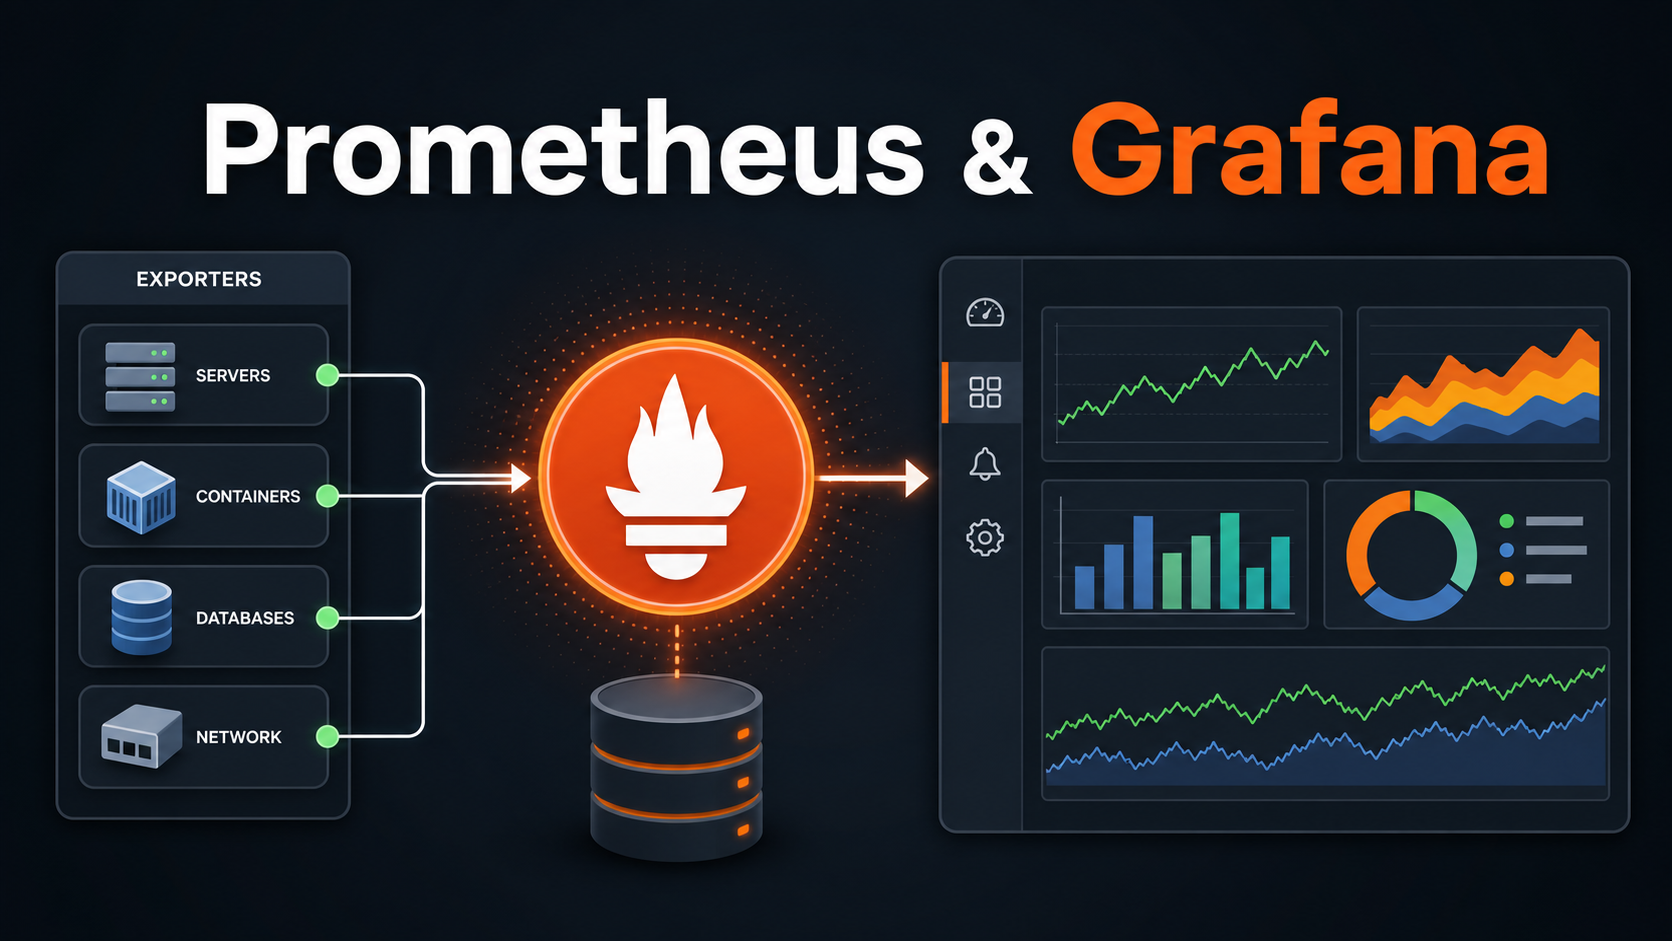
Prometheus collects and stores metrics; Grafana turns those metrics into dashboards and alerts. A practical beginner setup is: run Node Exporter on the machine you want to monitor, configure Prometheus to scrape localhost:9100, add Prometheus as a Grafana data source, then build panels with PromQL queries such as rate(node_cpu_seconds_total[5m]), node_memory_MemAvailable_bytes, and node_filesystem_avail_bytes. For production, add service discovery, labels, retention planning, alert routing, and dashboard-as-code.
Prometheus and Grafana are one of the most common monitoring combinations in DevOps because they split the job cleanly. Prometheus is responsible for collecting time-series metrics by scraping HTTP endpoints, storing those samples, and evaluating PromQL queries or alert rules. Grafana is responsible for exploration, dashboards, visualizations, and user-friendly alert workflows. Together, they help you answer operational questions such as: Is the server up? Is CPU saturation increasing? Are disks filling up? Did latency change after a deployment?
This tutorial walks through a realistic starter setup for Linux host monitoring, explains the moving parts, gives you useful PromQL examples, and highlights the mistakes that usually make a new monitoring stack noisy or misleading.
How Prometheus and Grafana Work Together
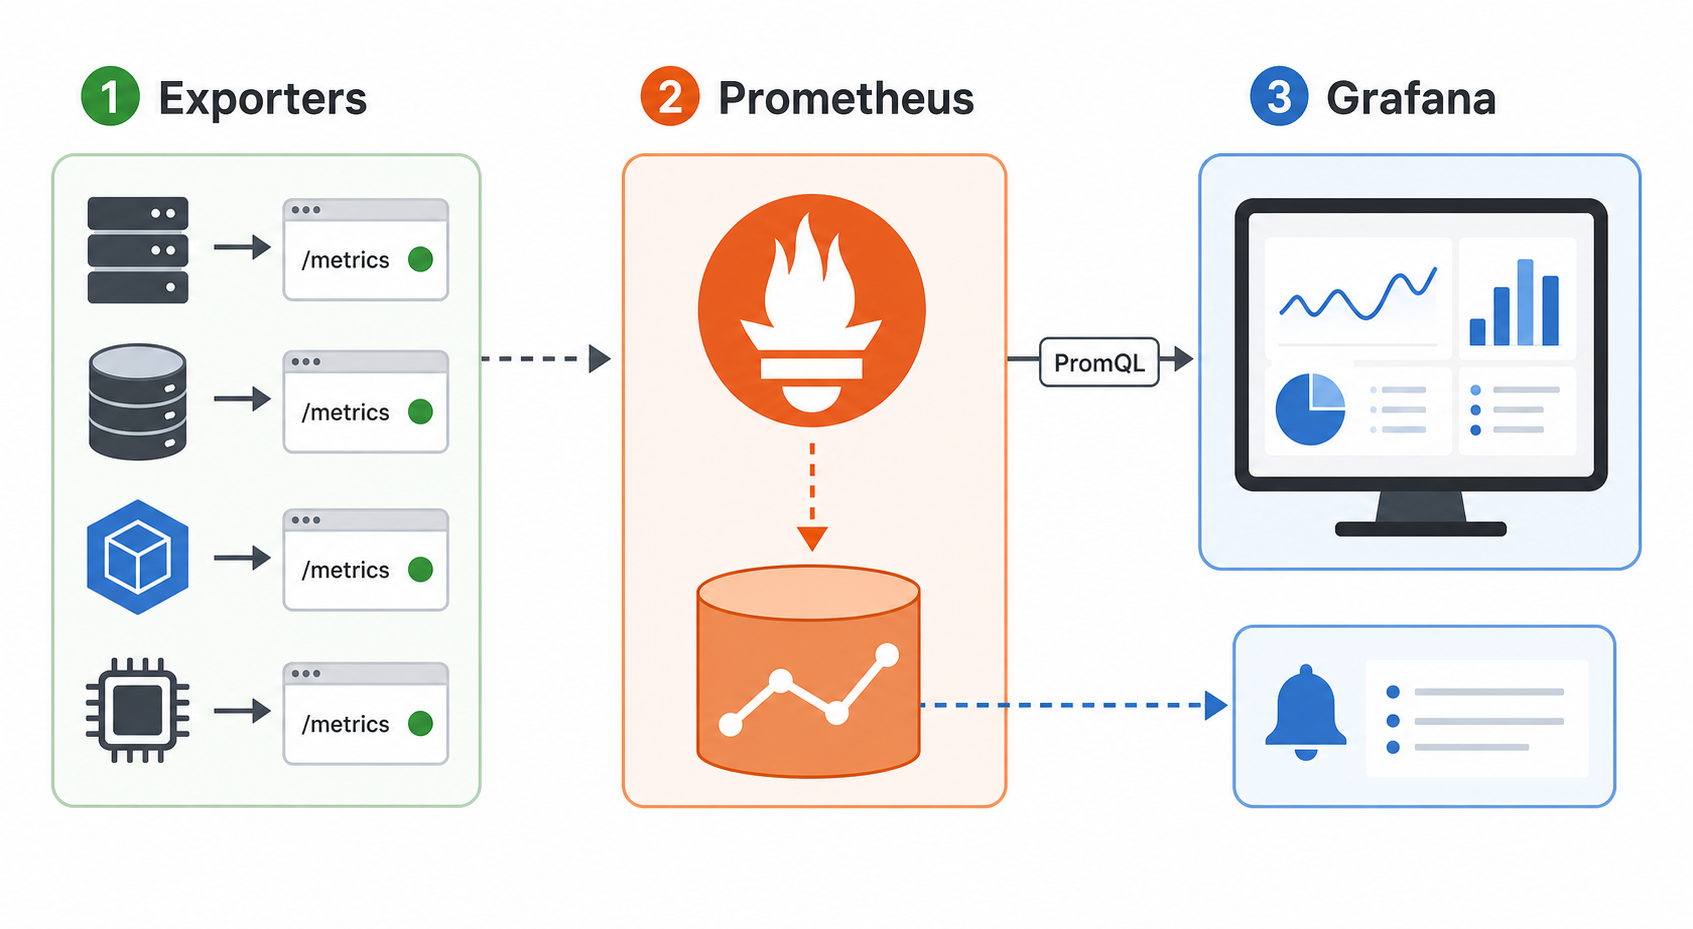
The basic architecture is simple:
- Target: the thing you want to monitor, such as a Linux host, Kubernetes node, application, database, or API.
- Exporter or metrics endpoint: an HTTP endpoint that exposes metrics in Prometheus format. Node Exporter is the standard exporter for Linux host metrics.
- Prometheus server: scrapes configured targets on a schedule and stores samples locally as time-series data.
- PromQL: Prometheus Query Language, used to calculate rates, averages, ratios, availability, and alert conditions.
- Grafana: connects to Prometheus as a data source and renders charts, tables, gauges, stat panels, and alert rules.
Prometheus is pull-based by default: it periodically requests /metrics from each target. This differs from tools where agents push data to a central endpoint. Pull-based monitoring makes target health visible because Prometheus can show whether a scrape target is up, down, slow, or returning errors.
Official references worth bookmarking while you build are the Prometheus getting started guide, Prometheus configuration reference, Node Exporter guide, and Grafana’s Prometheus data source documentation.
What You Will Build
By the end of this tutorial, you will have:
- Node Exporter exposing Linux host metrics on port
9100. - Prometheus scraping itself and Node Exporter on port
9090. - Grafana running on port
3000. - A Grafana dashboard for CPU, memory, disk, filesystem, and target health.
- Starter alert rules for target availability and disk usage.
The commands below use Docker Compose because it keeps the tutorial repeatable. If you prefer binaries or system packages, the same concepts apply: run the services, expose the ports, and point Prometheus at the right target endpoints.
Prerequisites
- A Linux machine, VM, or cloud instance.
- Docker and Docker Compose installed.
- Ports
9090,9100, and3000available locally. - Basic comfort with YAML and shell commands.
For production, do not expose Prometheus, Node Exporter, or Grafana directly to the public internet without authentication, TLS, firewall rules, and network segmentation.
Step 1: Create the Monitoring Project
Create a small working directory:
mkdir prometheus-grafana-demo
cd prometheus-grafana-demo
mkdir prometheus grafana
Add a Prometheus configuration file:
cat > prometheus/prometheus.yml <<'EOF'
global:
  scrape_interval: 15s
  evaluation_interval: 15s

scrape_configs:
  - job_name: prometheus
    static_configs:
      - targets: ["prometheus:9090"]

  - job_name: node
    static_configs:
      - targets: ["node-exporter:9100"]
EOF
The global block sets the default scrape and rule evaluation interval. The scrape_configs section defines jobs. Each job groups one or more targets that Prometheus should scrape. Official Prometheus configuration docs describe this model as scrape jobs with static targets or service-discovered targets.
Step 2: Run Prometheus, Node Exporter, and Grafana
Create a docker-compose.yml file:
services:
  prometheus:
    image: prom/prometheus:latest
    container_name: prometheus
    command:
      - "--config.file=/etc/prometheus/prometheus.yml"
      - "--storage.tsdb.retention.time=15d"
    ports:
      - "9090:9090"
    volumes:
      - ./prometheus/prometheus.yml:/etc/prometheus/prometheus.yml:ro
      - prometheus-data:/prometheus
    restart: unless-stopped

  node-exporter:
    image: prom/node-exporter:latest
    container_name: node-exporter
    ports:
      - "9100:9100"
    restart: unless-stopped

  grafana:
    image: grafana/grafana-oss:latest
    container_name: grafana
    ports:
      - "3000:3000"
    volumes:
      - grafana-data:/var/lib/grafana
    restart: unless-stopped

volumes:
  prometheus-data:
  grafana-data:
Start the stack:
docker compose up -d
docker compose ps
Now check the endpoints:
- Prometheus:
http://localhost:9090 - Node Exporter metrics:
http://localhost:9100/metrics - Grafana:
http://localhost:3000
Open Prometheus, then go to Status → Targets. You should see prometheus and node targets with state UP. If a target is down, fix that before building dashboards; dashboards built on broken scrape targets only hide the real problem.
Step 3: Understand the First Metrics
Prometheus stores metrics as time series. A time series has a metric name, labels, values, and timestamps. For example, Node Exporter exposes metrics such as:
node_cpu_seconds_total: CPU time split by CPU core and mode.node_memory_MemAvailable_bytes: available memory.node_filesystem_avail_bytes: available filesystem space.node_network_receive_bytes_total: network receive counter.up: whether Prometheus successfully scraped a target.
Try these queries in the Prometheus expression browser:
up

node_memory_MemAvailable_bytes

rate(node_cpu_seconds_total[5m])
The up query is the simplest health signal. A value of 1 means the scrape succeeded. A value of 0 means Prometheus knows the target but cannot scrape it successfully.
Step 4: Add Prometheus as a Grafana Data Source
Log in to Grafana at http://localhost:3000. The default local credentials are commonly admin / admin, and Grafana will prompt you to change the password.
Then add Prometheus:
- Go to Connections → Data sources.
- Choose Prometheus.
- Set the URL to
http://prometheus:9090because Grafana and Prometheus are on the same Compose network. - Click Save & test.
Grafana’s Prometheus data source supports PromQL queries, dashboard panels, Explore, and alert rules. For beginners, Explore is the best place to test a query before turning it into a dashboard panel.
Step 5: Build Useful Dashboard Panels
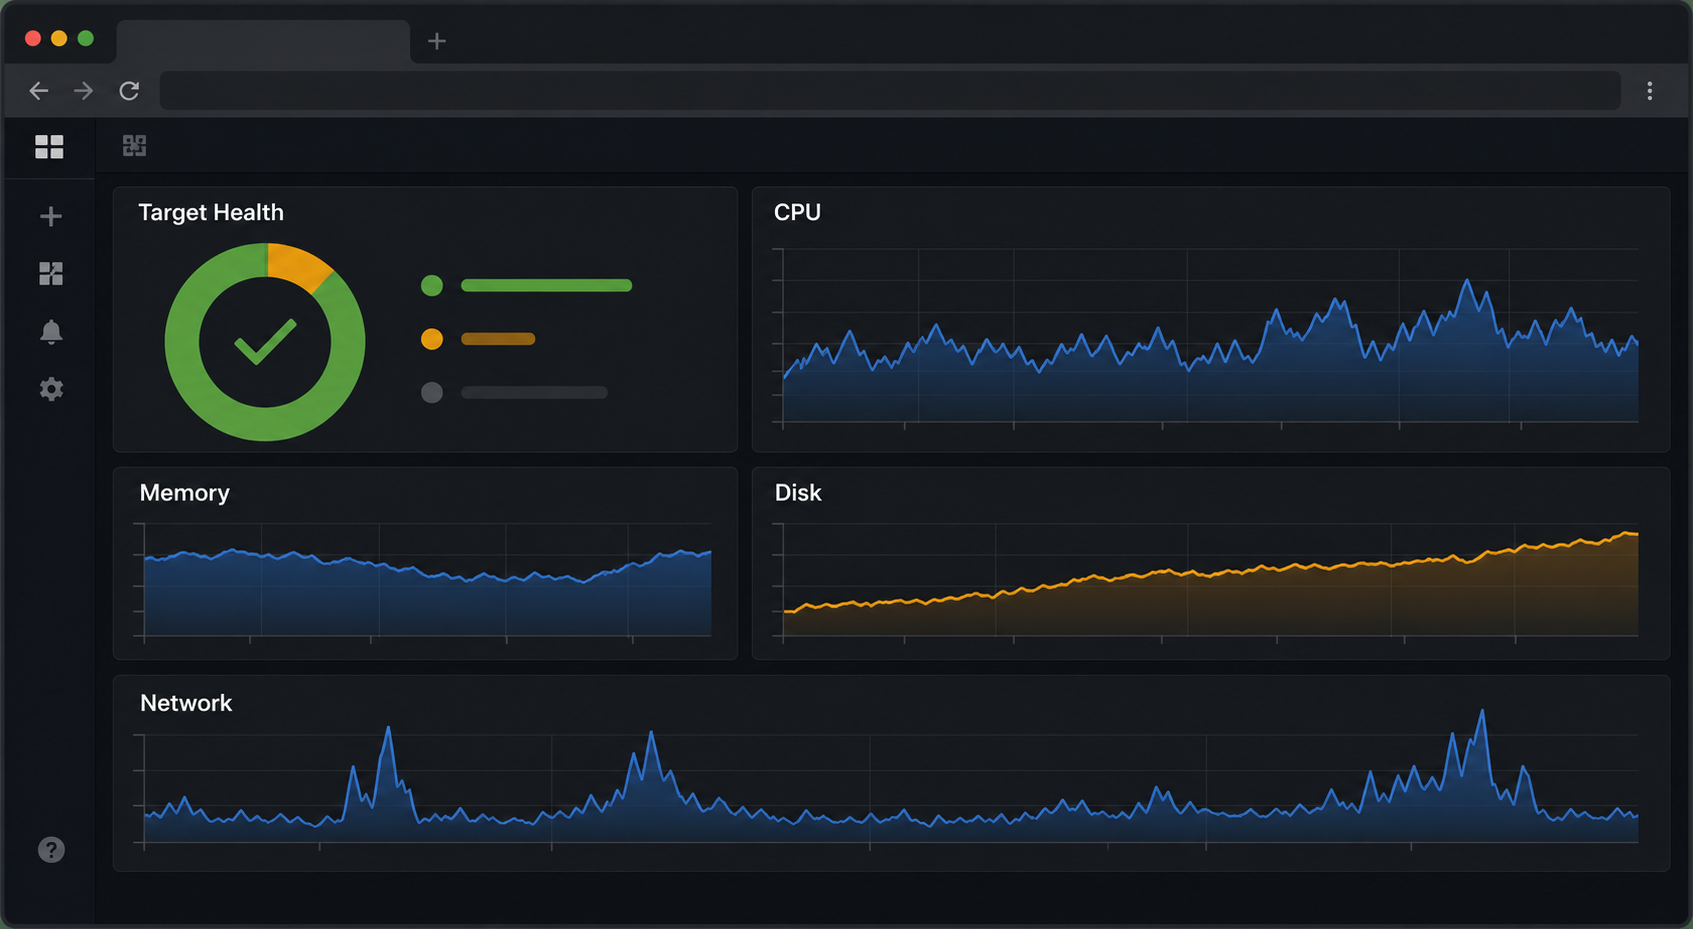
A good beginner dashboard should answer a few operational questions quickly. Avoid starting with twenty panels. Start with five that you can explain.
Target Health
up{job="node"}
Use a Stat panel. Show green for 1 and red for 0. This panel tells you whether Prometheus is actually collecting data from Node Exporter.
CPU Usage Percent
100 - (avg by (instance) (rate(node_cpu_seconds_total{mode="idle"}[5m])) * 100)
This query calculates non-idle CPU percentage over a five-minute window. Use a Time series panel. A short window such as [1m] reacts quickly but can be noisy; [5m] is a better starting point for dashboards.
Memory Available
node_memory_MemAvailable_bytes
Format the unit as bytes. Available memory is often easier to reason about than “used memory” because Linux intentionally uses memory for cache.
Disk Usage Percent
100 - (
  node_filesystem_avail_bytes{fstype!~"tmpfs|overlay"}
  /
  node_filesystem_size_bytes{fstype!~"tmpfs|overlay"}
  * 100
)
Filter out temporary or container overlay filesystems to reduce noise. In production, refine this query based on your actual filesystem labels and mount points.
Network Receive Rate
rate(node_network_receive_bytes_total{device!="lo"}[5m])
Use bytes per second as the unit. This is a starting point for spotting traffic changes, but it should not be your only network signal.
Step 6: Add Starter Alerts
Dashboards help humans inspect systems. Alerts should tell humans when action is needed. Start with a small number of high-signal alerts.
Target Down
up{job="node"} == 0
Set a pending period such as five minutes so a short restart does not page someone immediately.
Disk Almost Full
(
  node_filesystem_avail_bytes{fstype!~"tmpfs|overlay"}
  /
  node_filesystem_size_bytes{fstype!~"tmpfs|overlay"}
) < 0.15
This fires when a filesystem has less than 15% free space. For production, add labels or annotations that include the instance and mount point.
High CPU for a Sustained Period
100 - (avg by (instance) (rate(node_cpu_seconds_total{mode="idle"}[10m])) * 100) > 85
CPU alerts should be sustained and contextual. High CPU on a batch worker may be normal; high CPU on a latency-sensitive API may be urgent.
Common Mistakes Beginners Make
- Scraping too often: a one-second interval sounds precise but can increase load and storage quickly. Start with 15 or 30 seconds unless you have a reason.
- Alerting on every spike: use rate windows and pending periods. Alert fatigue makes monitoring less useful.
- Ignoring labels: labels make metrics powerful, but uncontrolled labels can create high cardinality and expensive queries.
- Using dashboards as proof of reliability: dashboards are only as good as the metrics and alerts behind them.
- Exposing endpoints publicly: metrics can leak hostnames, paths, service names, and internal topology.
- Copying dashboards blindly: imported dashboards are useful, but you should understand the queries your team depends on.
Troubleshooting Prometheus and Grafana
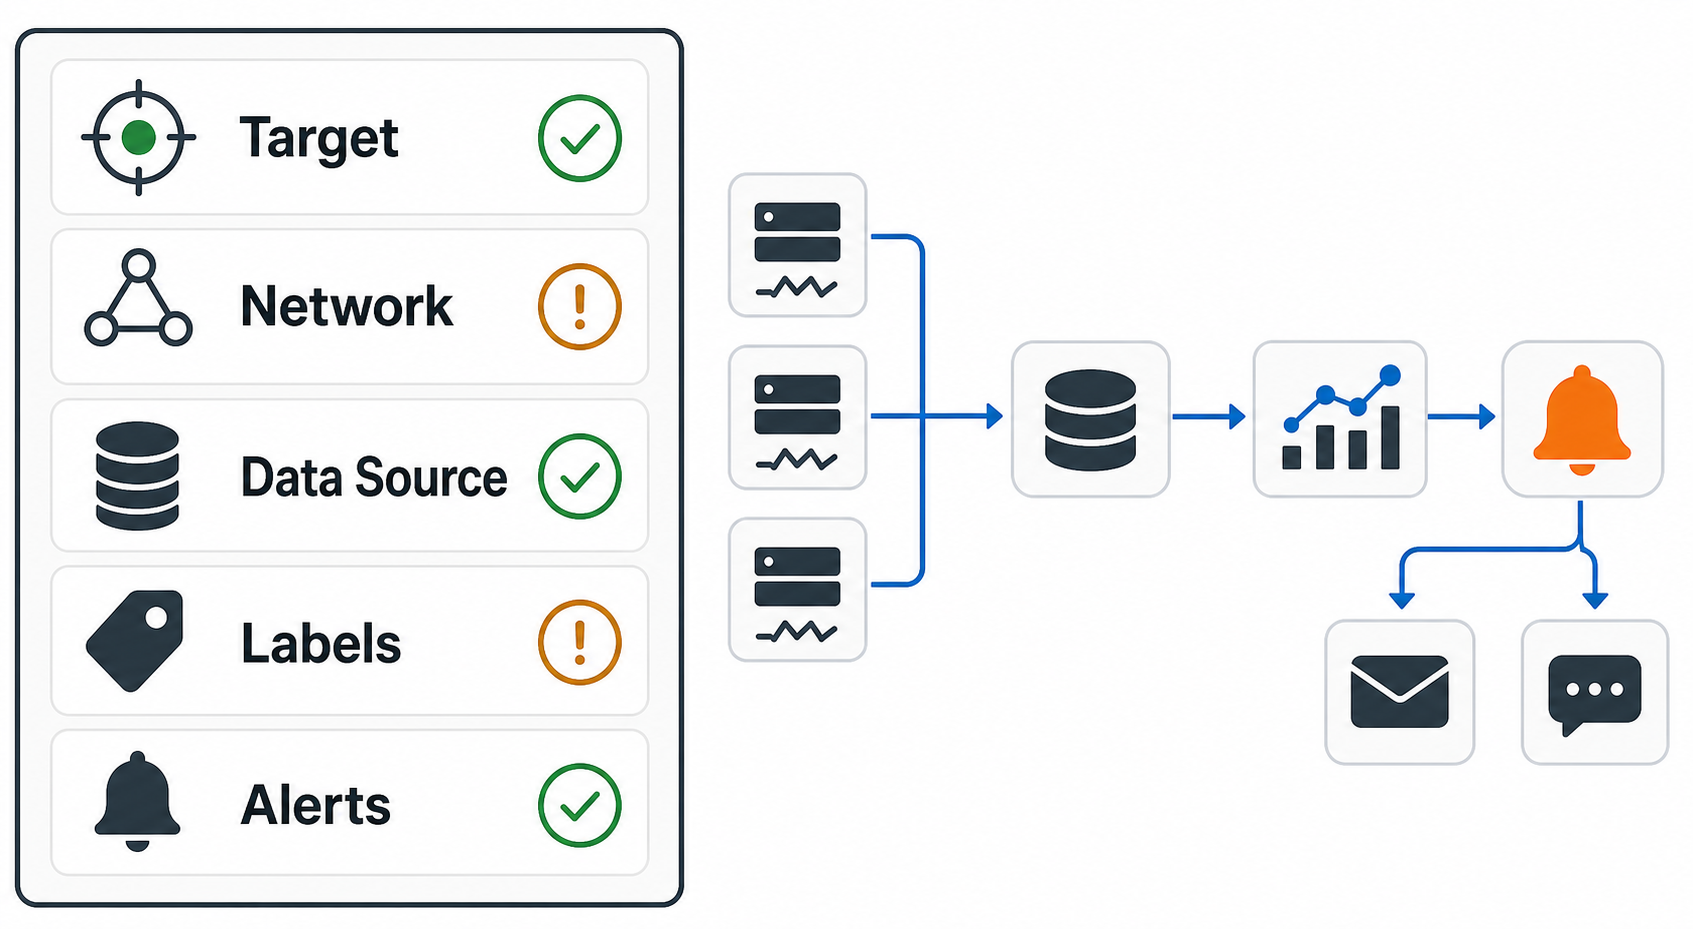
Prometheus Target Shows DOWN
Check the target URL from the Prometheus container:
docker exec -it prometheus wget -qO- http://node-exporter:9100/metrics | head
If this fails, the problem is networking, container name resolution, service health, or the exporter itself.
Grafana Cannot Connect to Prometheus
If Grafana runs in Docker Compose, use http://prometheus:9090, not http://localhost:9090. Inside the Grafana container, localhost means Grafana itself, not your host machine.
PromQL Query Returns No Data
Start broad, then narrow:
up
node_filesystem_avail_bytes
node_filesystem_avail_bytes{job="node"}
If the broad query works and the filtered query does not, inspect the actual labels in Grafana Explore or Prometheus before assuming the metric is missing.
Dashboard Looks Too Noisy
Use longer query windows, aggregate by useful labels, and separate high-level service health from low-level host details. A dashboard should guide attention, not display every metric available.
Production Checklist
- Use service discovery for dynamic infrastructure instead of editing static targets manually.
- Protect Prometheus, Grafana, exporters, and Alertmanager with network controls and authentication where appropriate.
- Define retention based on storage capacity and investigation needs.
- Keep dashboard JSON, alert rules, and provisioning files in version control.
- Document alert ownership, severity, runbooks, and escalation paths.
- Monitor the monitoring system: scrape failures, rule evaluation duration, storage usage, and Grafana availability.
- Be careful with high-cardinality labels such as request IDs, user IDs, unique URLs, or pod names that churn rapidly.
Prometheus vs Grafana: What Each Tool Does
| Capability | Prometheus | Grafana |
|---|---|---|
| Collect metrics | Yes, by scraping targets | No, it queries data sources |
| Store time-series metrics | Yes | No, not for Prometheus metrics |
| Query language | PromQL | Uses the data source query language, including PromQL |
| Dashboards | Basic graphing | Strong dashboard and visualization experience |
| Alerting | Prometheus rules and Alertmanager | Grafana-managed alerts and notification integrations |
Next Steps
Once this local setup works, extend it in the direction of your real environment:
- For Kubernetes, learn how Prometheus discovers pods, services, and nodes. Start with Amazon EKS Tutorial: Kubernetes on AWS and Azure AKS Tutorial: Managed Kubernetes.
- For deployment automation, connect monitoring with your release process. See Best CI/CD Tools 2026 Compared and GitOps with Argo CD: Tutorial.
- For infrastructure provisioning, store dashboards and alert rules alongside Terraform, Pulumi, or OpenTofu configuration. See Terraform vs Pulumi vs OpenTofu: Best IaC Tool.
- For AI-assisted operations, compare this metrics foundation with Best AIOps Tools in 2026 and What is LLMOps?.
- If you are new to AI concepts that increasingly appear in observability products, read What is Generative AI? A Beginner’s Guide.
FAQ
Is Prometheus the same as Grafana?
No. Prometheus collects, stores, and queries metrics. Grafana visualizes metrics from Prometheus and other data sources. They are commonly used together, but they solve different parts of the monitoring workflow.
Do I need Grafana if Prometheus has a web UI?
For learning PromQL, the Prometheus web UI is enough. For team dashboards, polished visualizations, shared panels, alert workflows, and multiple data sources, Grafana is usually the better interface.
What is Node Exporter used for?
Node Exporter exposes Linux host metrics such as CPU, memory, disk, filesystem, and network statistics in Prometheus format. Prometheus scrapes Node Exporter on port 9100 by default.
What is a good Prometheus scrape interval?
For many infrastructure metrics, 15 to 30 seconds is a reasonable starting point. Use shorter intervals only when you need finer resolution and understand the storage and load impact.
Should alerts live in Prometheus or Grafana?
Both can work. Prometheus alerting with Alertmanager is common in infrastructure-heavy environments, while Grafana-managed alerts are convenient for teams that already manage dashboards and notifications in Grafana. The best choice depends on ownership, tooling, and how you version-control alert rules.
Can Prometheus monitor Kubernetes?
Yes. Prometheus is widely used for Kubernetes monitoring, but production Kubernetes setups usually rely on service discovery, exporters, kube-state-metrics, and often the Prometheus Operator or a managed monitoring stack.
Related GravityDevOps Guides
- Best CI/CD Tools 2026 Compared for release pipelines and post-deployment monitoring.
- GitOps with Argo CD: Tutorial for Kubernetes deployment workflows where Prometheus alerts can catch rollout issues.
- Amazon EKS Tutorial: Kubernetes on AWS and Azure AKS Tutorial: Managed Kubernetes for managed Kubernetes monitoring context.
- Best AIOps Tools in 2026 for teams comparing classic metrics monitoring with AI-assisted operations platforms.
- What is Generative AI? A Beginner’s Guide for readers exploring AI concepts used in modern observability products.


