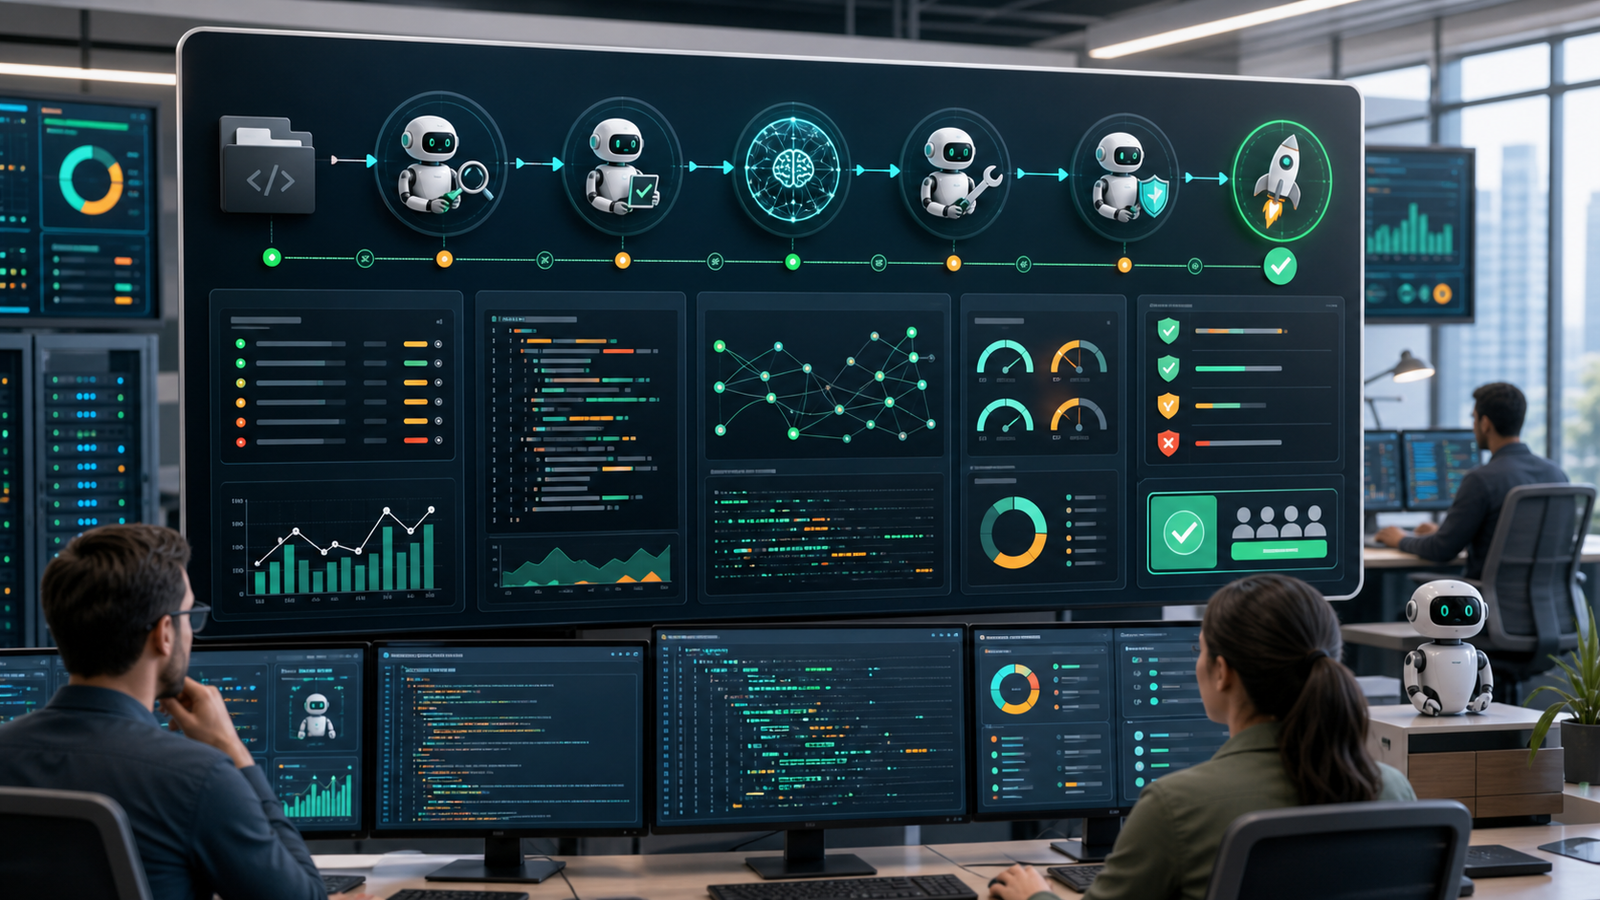

AI agent observability means being able to reconstruct what an agent was asked to do, what context it used, which model and tools it called, what changed, whether the result was correct, how much the run cost, and when a human intervened. DevOps teams need logs for events, traces for execution paths, metrics for health and cost, evaluations for quality, and alerts for conditions that require action.
Traditional service monitoring is still necessary, but it is not enough. A healthy API can serve an agent that chose the wrong tool, exceeded its scope, exposed sensitive context, repeated a failed action, or produced a plausible answer that did not satisfy the task. Agent monitoring must connect model behavior to repository, CI/CD, identity, policy, and production outcomes.
This guide assumes the agent can use tools or change engineering artifacts. For the underlying loop, start with how AI agents plan, act, observe, and stop. For delivery controls, use the companion guide to AI agents in CI/CD from code review to deployment.
Table of contents
- The observability model
- What to log
- How to trace an agent run
- Evals for DevOps work
- Alerts and intervention
- Security and data boundaries
- A practical rollout plan
- Frequently asked questions
The AI agent observability model
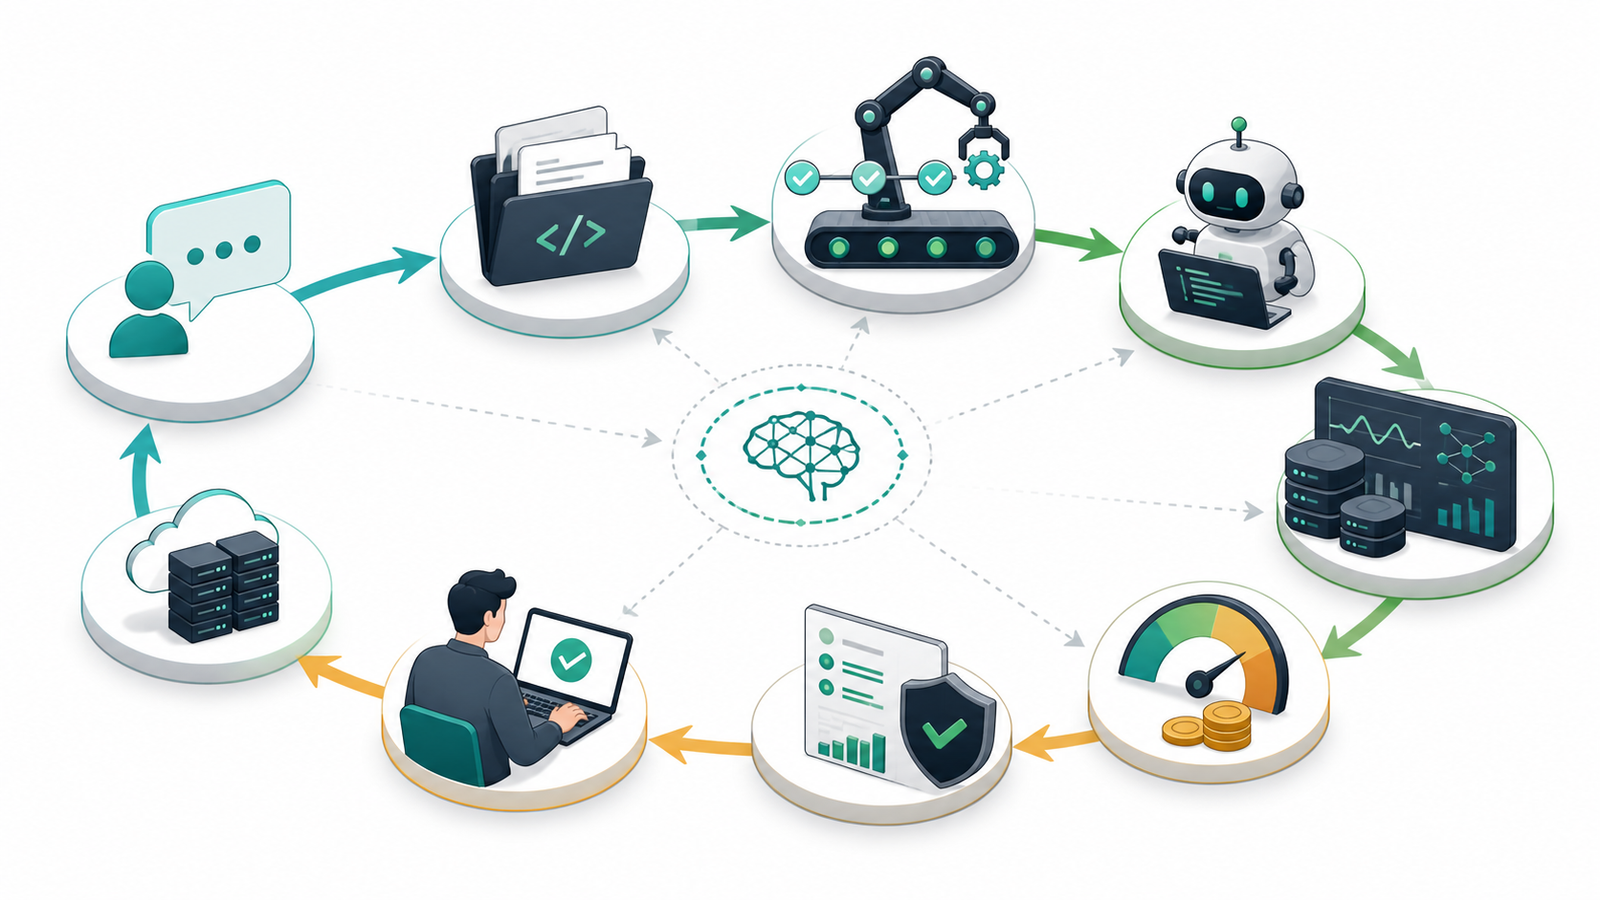
Start with one durable run identifier that follows the task across the agent runtime, model gateway, tool calls, repository branch, pull request, CI jobs, approvals, deployment, and incident records. Without that correlation key, teams end up with several dashboards that cannot answer one basic question: did this agent run produce a safe and useful outcome?
| Signal | Question it answers | Useful fields or evidence |
|---|---|---|
| Logs | What event happened? | Run ID, timestamp, actor, tool, target, status, policy decision, error class |
| Traces | How did the run move from goal to outcome? | Agent, generation, retrieval, tool, handoff, approval, and deployment spans |
| Metrics | Is behavior healthy over time? | Task success, tool errors, latency, token usage, cost, retries, denials, rework |
| Evals | Was the result correct and useful? | Acceptance criteria, evidence quality, scope compliance, safety checks, reviewer score |
| Alerts | When must a person or policy intervene? | Permission escalation, repeated failure, unusual spend, secret exposure, unsafe target |
| Outcome data | Did the work improve delivery? | Merged or rejected, reverted, escaped defect, incident impact, time to resolution |
Google Cloud’s agent observability guidance uses the same basic separation: logs describe events and errors, metrics show measures such as latency and token usage, traces show execution paths, and prompt/response data can support quality evaluation. OpenTelemetry provides common semantic conventions for traces, metrics, logs, events, and resources, although parts of the GenAI and agent conventions continue to evolve.
What to log for an AI agent
A useful event log explains the action without becoming a warehouse of secrets. Record the run ID, task summary, requester or automation identity, repository and environment, model and policy versions, tool name, sanitized parameters, target resource, approval state, result status, duration, and error category.
For coding and DevOps agents, also link the run to the issue, branch, commit, pull request, workflow run, artifact digest, deployment, and rollback when they exist. GitHub’s current agent-session documentation illustrates this correlation: session views expose progress, token usage, duration, tool activity, and links from commits back to session logs.
Do not log complete prompts and tool outputs by default merely because storage is available. Prompts can contain source code, credentials, customer data, incident details, or malicious instructions copied from external content. Store a sanitized task summary when that is enough. If full payload retention is necessary for debugging or evaluation, define access control, encryption, region, retention period, deletion, and audit requirements first.
How to trace an agent run
A trace should show the causal path from goal to result. The root span represents the run or workflow. Child spans represent model generations, retrieval, tool calls, agent handoffs, policy checks, approvals, and external changes. Each span should include start and end time, status, error information, and enough identifiers to locate the related system record.
- Agent span: goal, instructions version, scope, environment, and final state.
- Generation span: model, latency, token usage, status, and a reference to retained input/output where policy permits.
- Tool span: tool identity, validated target, read or write classification, result, retry count, and policy decision.
- Handoff span: source and destination agent, context transferred, and authority retained or changed.
- Approval span: requested action, approver identity, decision, expiry, and conditions.
- Outcome span: pull request, CI result, artifact, deployment, rollback, or other externally verifiable result.
OpenAI’s current agent tracing documentation similarly groups model responses, tool calls, and delegated work as spans within a turn and session. The important design choice is not a particular vendor UI. It is keeping the trace portable enough to correlate with the rest of the engineering system. OpenTelemetry’s semantic conventions give teams a shared naming approach, while the GenAI registry includes agent and workflow operation types, tool attributes, and token-usage fields.
Trace sampling needs a risk-aware policy. Keep all runs that change state, cross a trust boundary, trigger an alert, fail an evaluation, receive human correction, or produce a rollback. Lower-risk successful runs can be sampled if volume or cost requires it. Preserve aggregate metrics even when detailed payloads are not retained.
Evals for DevOps work
Latency and token counts cannot tell you whether an agent solved the task. DevOps evals should reflect the acceptance criteria and engineering controls that already define success.
| Evaluation dimension | Example check | Failure signal |
|---|---|---|
| Task completion | Required behavior is implemented and verified | Agent stops with missing acceptance criteria |
| Evidence quality | Diagnosis cites the relevant log, diff, test, or policy result | Conclusion cannot be traced to evidence |
| Scope compliance | Only approved files, services, or environments changed | Unrelated file or protected target modified |
| Technical correctness | Tests, lint, build, scanners, and policy checks pass | Generated change fails a deterministic gate |
| Security | No secret exposure, unsafe dependency, or permission expansion | Credential appears in context or privilege increases |
| Review effort | Human can approve with limited rework | Large rewrite or repeated correction required |
| Production outcome | Change remains healthy after deployment | Revert, rollback, escaped defect, or incident |
Maintain a small regression set of representative tasks: a failed build with known cause, a safe dependency update, a workflow permission change, an infrastructure plan, and an incident summary. Run those evals when the model, prompt, tool contract, retrieval source, or policy changes. Production feedback should then add difficult real cases to the set.
Separate suggestion quality from execution safety. A good diagnosis can still be unsafe to execute automatically. A correctly formed tool call can still pursue the wrong goal. Review both the answer and the trajectory that produced it.
Alerts and intervention
Alert on conditions that require a decision, not every unusual token count. Useful alert candidates include:
- a read-only task attempts a write or requests broader permission;
- a tool targets production, a protected branch, or an unapproved repository;
- secret scanning detects a credential in agent input, output, or logs;
- the agent repeats the same failed tool call or exceeds its step limit;
- cost, tokens, duration, or retries deviate materially from that task class;
- a required evaluation, CI check, security scan, or approval is missing or fails;
- the agent changes workflow permissions, identity configuration, deployment logic, or policy files;
- a deployed change is followed by an SLO breach, rollback, or incident.
Every alert needs an owner and a safe action: pause the run, revoke the tool, require approval, block the merge, stop the deployment, or start rollback. An alert that only posts another message into a noisy channel is not a control.
Security and data boundaries
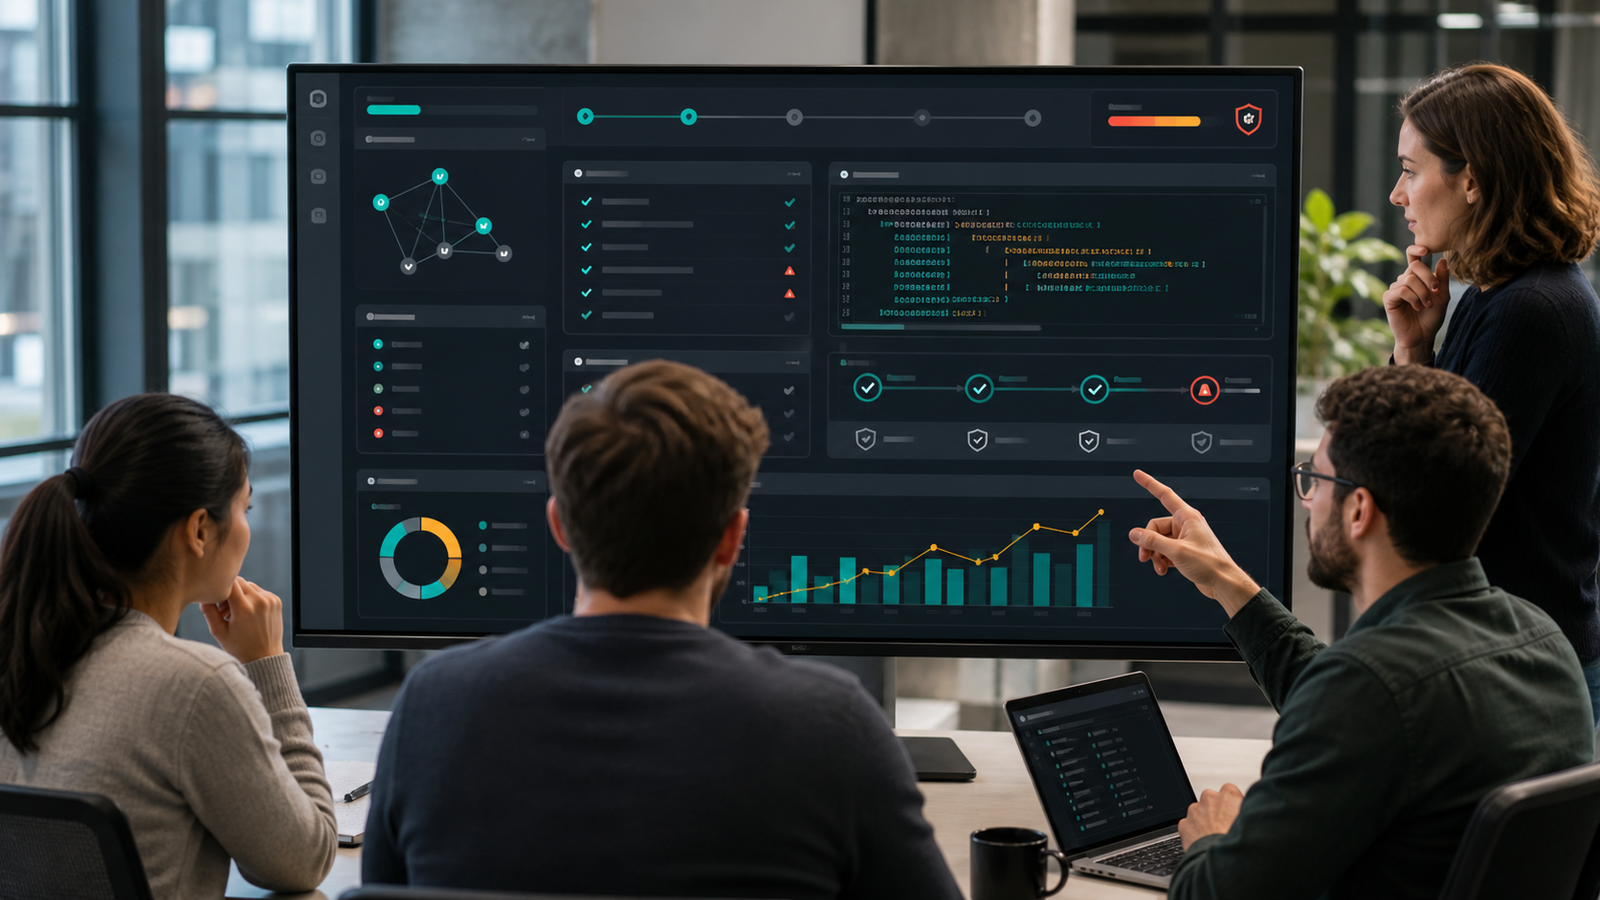
Observability can create a second copy of the most sensitive data an agent handled. Treat telemetry as production data. Apply least privilege to dashboards and trace APIs, separate environments and tenants, encrypt data in transit and at rest, and document retention and deletion. Redact credentials before export rather than assuming a downstream system will catch every transformed secret.
Do not record hidden reasoning or sensitive intermediate content merely to make a dashboard look complete. Capture decisions, tool calls, policy results, approvals, and evidence that operators can use. Where full prompts or outputs are retained, make that an explicit, reviewed choice.
Prompt injection also belongs in observability. Record which inputs came from pull requests, issues, email, web pages, documents, or tool responses. If untrusted text attempts to redirect the workflow, the policy layer should block the action and emit a security event. The AI DevSecOps pipeline guide covers the review and scanning gates around generated changes.
A practical rollout plan
- Inventory one workflow. Choose a bounded use case such as CI failure summarization or documentation updates.
- Assign a run ID. Propagate it through model, tool, repository, CI, approval, and outcome records.
- Define a minimum event schema. Record task, scope, tool, target, policy decision, status, duration, and error without copying sensitive payloads by default.
- Add end-to-end tracing. Link agent, generation, retrieval, tool, approval, and outcome spans.
- Create representative evals. Test task completion, evidence, scope, security, engineering gates, and review effort.
- Set intervention rules. Pause on permission expansion, protected targets, repeated failures, missing gates, or secret exposure.
- Measure outcomes. Compare successful tasks, review time, rework, cost, rollback, and incidents—not just agent activity.
- Expand authority slowly. Move from manual assistance to supervised pull requests, then to guarded low-risk automation only after the evidence supports it.
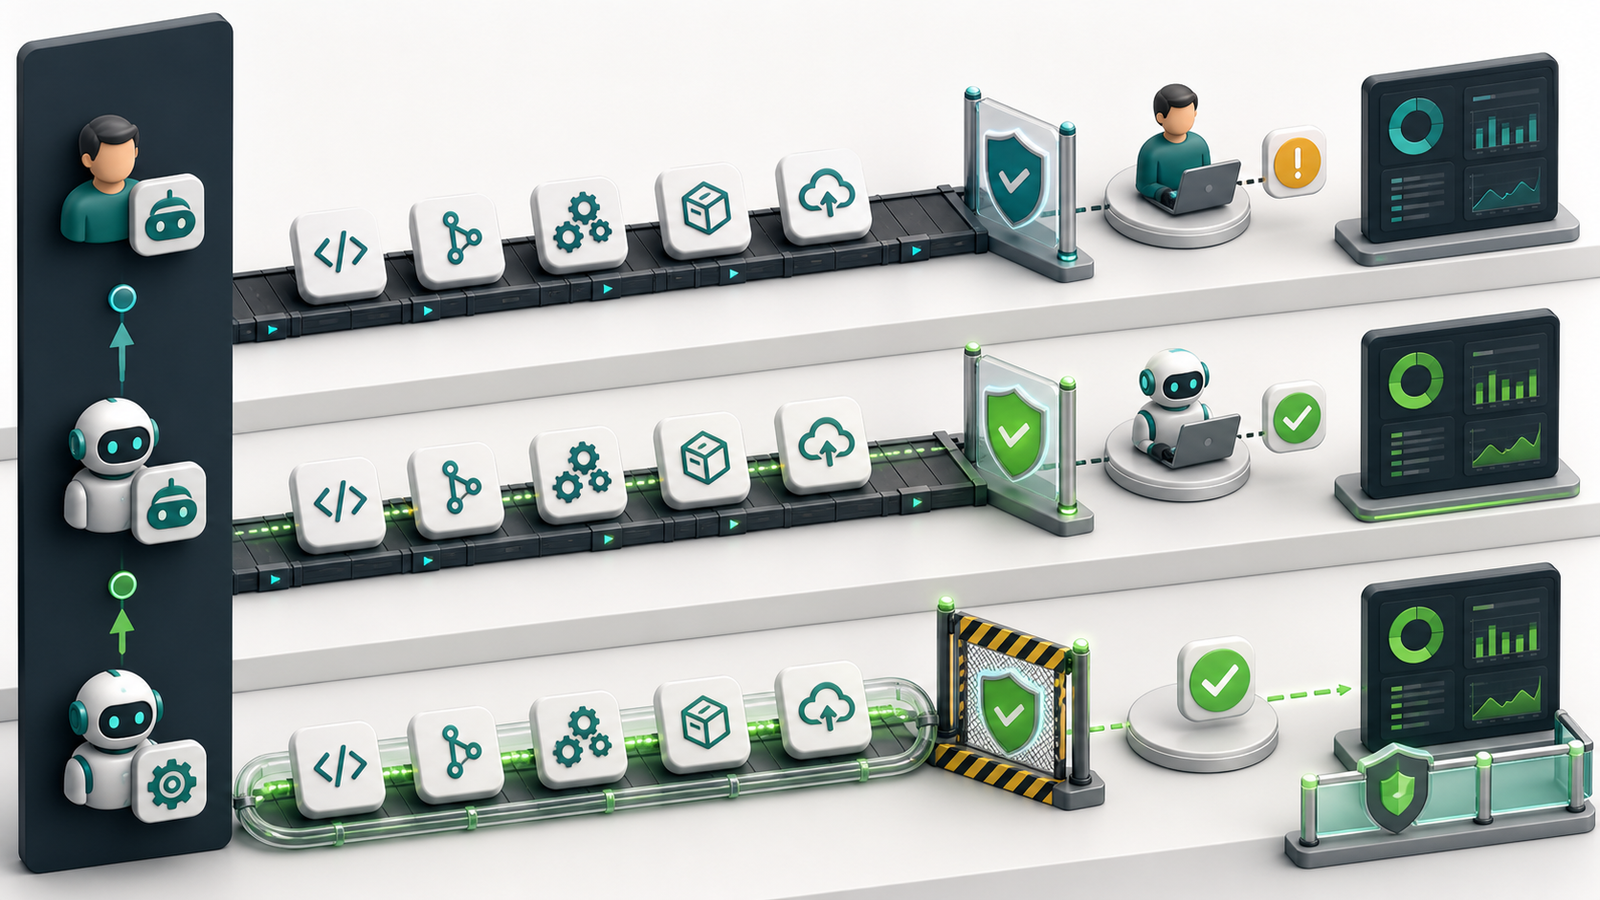
For teams already operating model-backed applications, connect agent telemetry to the LLMOps lifecycle rather than building an isolated dashboard. Model versions, evaluations, costs, incidents, and release decisions should follow the same ownership and change-management practices as the surrounding service.
How to evaluate an observability tool
| Criterion | Question to ask |
|---|---|
| Correlation | Can one run ID connect model calls, tools, code changes, CI, approvals, deployments, and incidents? |
| Open standards | Can telemetry use or export OpenTelemetry-compatible traces, metrics, and logs? |
| Evaluation | Can the platform run regression sets and connect scores to traces and outcomes? |
| Data controls | Can teams redact payloads, control retention, isolate tenants, and restrict trace access? |
| Cost visibility | Can usage be attributed by team, task type, model, agent, and successful outcome? |
| Alerting | Can alerts trigger a meaningful control such as pause, deny, approval, or rollback? |
| Auditability | Are policy decisions, approvals, tool effects, and configuration changes preserved? |
| Portability | Can the team export data and preserve identifiers across model or framework changes? |
Frequently asked questions
What is AI agent observability?
AI agent observability is the ability to reconstruct an agent’s goal, context, model calls, tool use, decisions, cost, evaluations, approvals, external changes, and final outcome using correlated logs, traces, metrics, and records.
How is agent observability different from application monitoring?
Application monitoring asks whether software is available and performing well. Agent observability also asks whether the system chose the right action, used appropriate context and permissions, satisfied the task, and produced a safe external effect.
Which metrics matter most?
Start with task success, tool error rate, latency, retries, token usage, cost per successful task, policy denials, human rework, rollback, and production incidents. Choose metrics that connect agent activity to engineering outcomes.
Should teams store full prompts and responses?
Not by default. Full payloads may contain sensitive code, credentials, customer data, or malicious content. Store sanitized summaries when possible and apply explicit access, retention, region, encryption, and deletion controls when full payloads are necessary.
What should trigger an alert?
Alert when a run requests broader permission, targets a protected system, exposes a secret, repeats a failed action, exceeds its limits, misses a required gate, fails an evaluation, or contributes to a rollback or incident.
Can OpenTelemetry be used for AI agents?
Yes. OpenTelemetry supports common traces, metrics, logs, events, and resource attributes, and its GenAI work includes model, tool, agent, and workflow concepts. Because some conventions remain under development, version the schema and plan migrations.
Related GravityDevOps guides
- AI Agents Explained: Agentic AI in 2026
- AI Agents vs AI Assistants vs Chatbots
- AI Agents for CI/CD: From Code Review to Deployment
- AI DevSecOps Pipeline for AI-Generated Code
- What Is LLMOps?


